


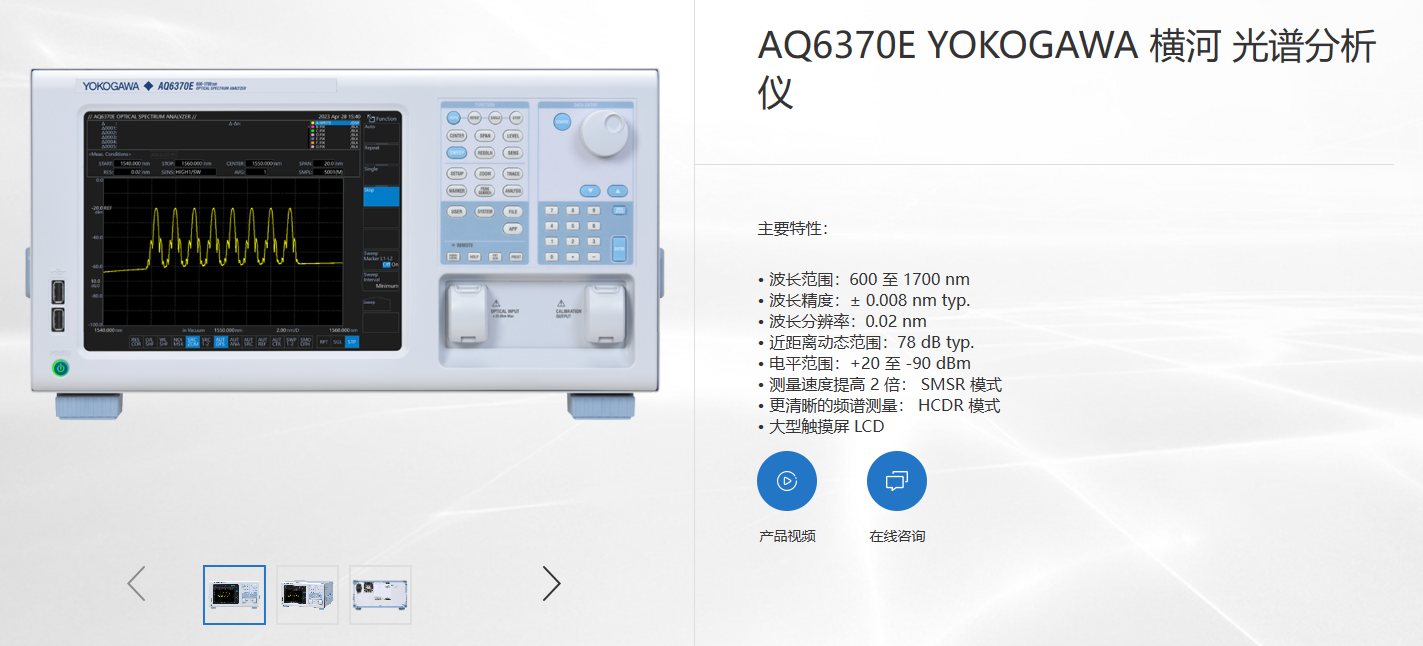
Customisation of the Yokogawa Spectrum Analyser OSA


In order to further target industry application needs, the newly released AQ6370E and future releases of the Yokogawa OSA will have a new APP function and provide users with more and more targeted device customisation based on the analysis function:
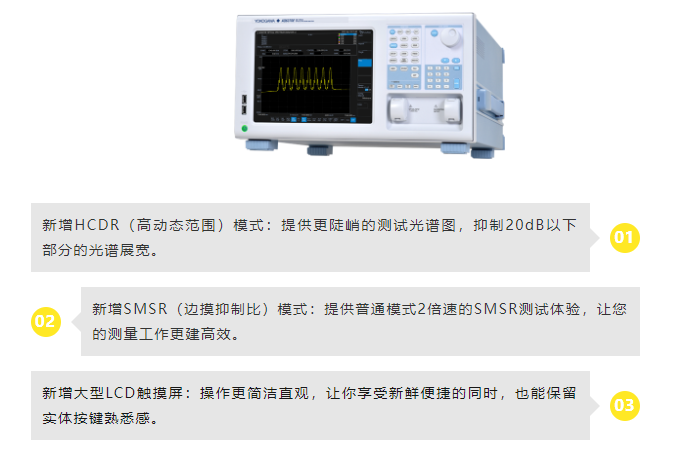
Yokogawa Spectrum Analyser Responds to User-Specific Testing Needs
Yokogawa OSA opens the "algorithm selection" and "parameter setting" privileges to users for a variety of analysis functions: for example, in spectral width analysis, users are provided with measurement methods such as threshold, envelope, root mean square, and root mean square of the peak; in SMSR side mode For example, in the spectral width analysis, we provide users with the threshold method, envelope method, root mean square method and peak root mean square method; in the SMSR side mode suppression ratio analysis, we provide users with four side mode definition algorithms.
In response to customer needs for analysis of different spectral intervals, the Yokogawa OSA provides users with the option of automatic analysis and delineation of analysis zones:
Yokogawa Spectrum Analyser's Automatic Analysis Function
In general, the automatic analysis setting of Yokogawa OSA is off by default, and the user needs to click the corresponding analysis function after completing the spectral scanning to perform the analysis operation; when the automatic analysis function is turned on, the device will perform the analysis after the completion of each scanning and present the analysis results to the top of the screen.
Zoning Function
The Yokogawa OSA's interval delimitation function can also be activated by using line markers and ZOOM intervals to delimit analysis intervals. After the spectrometer has performed the default analysis of the scanning interval, users who need to analyse different intervals of the optical signal can select the analysis intervals intuitively and conveniently by turning on the interval delimitation function in the Analysis Function Menu, page 2.
During the operation, if the user marks L1 and L2 as the set line for interval analysis, the spectrometer will only analyse the spectra in the L1-L2 region after the analysis is turned on; if the user turns on the ZOOM interval analysis, the screen will directly display the zoomed spectra and the original spectra will be displayed at the bottom right of the screen by default, and the spectrometer will only analyse the spectra in the zoomed intervals after the analysis is carried out.
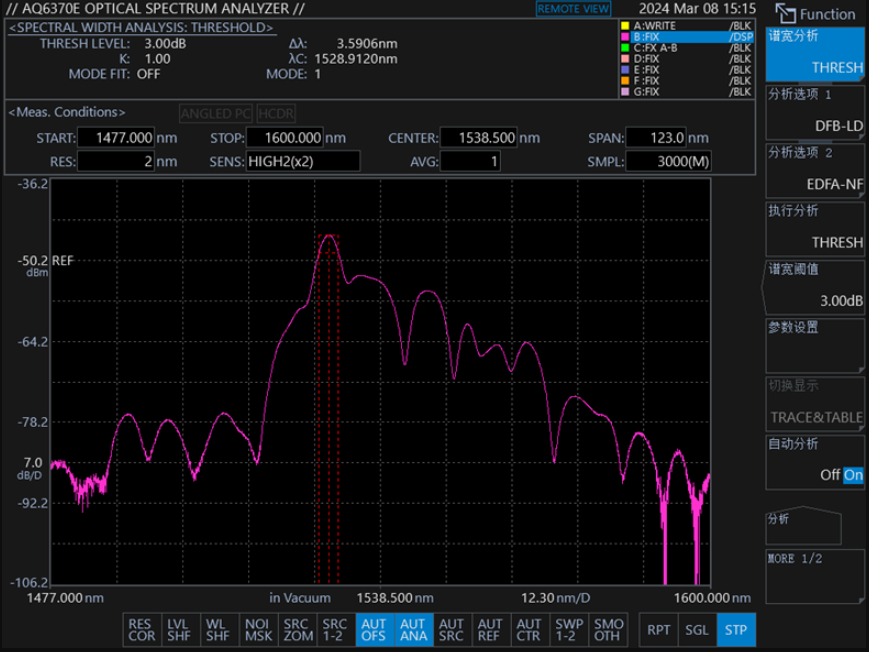
图4:将整个扫描区间设定为执行3dB谱宽分析且未开启设定线标记的L1、L2区间分析示意图

Figure 5: Schematic of L1 and L2 intervals analysed by setting the entire scanning interval to perform 3dB spectral width analysis and turning on the set line marker
List of Commonly Used Analysis Functions
Yokogawa OSA provides a variety of commonly used analysis functions, in which the parameter settings of each analysis function are the industry's common standards by default, but of course, users can also customise the relevant data according to their own measurement needs.
The commonly used analysis functions provided by Yokogawa OSA are as follows:
Spec Width analysis
NOTCH Trap Width Analysis
DFB-LD laser analysis
FP-LD laser analysis
LED light source analysis
POWER Integral Power Analysis
SMSR Side Mode Rejection Ratio Analysis
ITLA Laser Analysis
WDM transmission signal analysis
EDFA-NF Optical Amplification Gain and NF Measurement
FILTER-PEAK Filter Peak Analysis
FILTER-PEAK filter valley analysis
WDM FIL-PEAK WDM Filter Peak Analysis
WDM FIL-PEAK WDM filter valley analysis
In order to further target industry application needs, the newly released AQ6370E and future releases of the Yokogawa OSA will have a new APP function and provide users with more and more targeted device customisation based on the analysis function:
Yokogawa Spectrum Analyser Responds to User-Specific Testing Needs
Yokogawa OSA opens the "algorithm selection" and "parameter setting" privileges to users for a variety of analysis functions: for example, in spectral width analysis, users are provided with measurement methods such as threshold, envelope, root mean square, and root mean square of the peak; in SMSR side mode For example, in the spectral width analysis, we provide users with the threshold method, envelope method, root mean square method and peak root mean square method; in the SMSR side mode suppression ratio analysis, we provide users with four side mode definition algorithms.
In response to customer needs for analysis of different spectral intervals, the Yokogawa OSA provides users with the option of automatic analysis and delineation of analysis zones:
Yokogawa Spectrum Analyser's Automatic Analysis Function
In general, the automatic analysis setting of Yokogawa OSA is off by default, and the user needs to click the corresponding analysis function after completing the spectral scanning to perform the analysis operation; when the automatic analysis function is turned on, the device will perform the analysis after the completion of each scanning and present the analysis results to the top of the screen.
Zoning Function
The Yokogawa OSA's interval delimitation function can also be activated by using line markers and ZOOM intervals to delimit analysis intervals. After the spectrometer has performed the default analysis of the scanning interval, users who need to analyse different intervals of the optical signal can select the analysis intervals intuitively and conveniently by turning on the interval delimitation function in the Analysis Function Menu, page 2.
During the operation, if the user marks L1 and L2 as the set line for interval analysis, the spectrometer will only analyse the spectra in the L1-L2 region after the analysis is turned on; if the user turns on the ZOOM interval analysis, the screen will directly display the zoomed spectra and the original spectra will be displayed at the bottom right of the screen by default, and the spectrometer will only analyse the spectra in the zoomed intervals after the analysis is carried out.
图4:将整个扫描区间设定为执行3dB谱宽分析且未开启设定线标记的L1、L2区间分析示意图
Figure 5: Schematic of L1 and L2 intervals analysed by setting the entire scanning interval to perform 3dB spectral width analysis and turning on the set line marker
List of Commonly Used Analysis Functions
Yokogawa OSA provides a variety of commonly used analysis functions, in which the parameter settings of each analysis function are the industry's common standards by default, but of course, users can also customise the relevant data according to their own measurement needs.
The commonly used analysis functions provided by Yokogawa OSA are as follows:
Spec Width analysis
NOTCH Trap Width Analysis
DFB-LD laser analysis
FP-LD laser analysis
LED light source analysis
POWER Integral Power Analysis
SMSR Side Mode Rejection Ratio Analysis
ITLA Laser Analysis
WDM transmission signal analysis
EDFA-NF Optical Amplification Gain and NF Measurement
FILTER-PEAK Filter Peak Analysis
FILTER-PEAK filter valley analysis
WDM FIL-PEAK WDM Filter Peak Analysis
WDM FIL-PEAK WDM filter valley analysis