


25G Optical Module Eye Diagram, do you really understand? What test eye diagram equipment is needed?


Optical module is an indispensable component in the optical fibre communication system, which is responsible for converting electrical signals into optical signals or optical signals into electrical signals, so as to achieve the transmission of data. With the development of communication technology, the rate of optical modules is also increasing, from the initial hundreds of megabits per second to the current dozens or even hundreds of gigabits per second, the performance requirements of optical modules are also getting higher and higher. So, how to evaluate the performance of an optical module? Is there a simple and effective method? The answer is yes, that is eye diagram.
Eye diagram is a tool used to observe the quality and performance of high-speed digital signals, which can reflect a lot of information about the signal, such as noise, jitter, inter-code crosstalk, extinction ratio, signal-to-noise ratio and so on. Eye diagram is a series of digital signals accumulated on the oscilloscope and displayed graphics, it is similar to the shape of an eye, hence the name. The size and clarity of the eye diagram can reflect the quality of the signal. Generally speaking, the larger and clearer the eye diagram is, the better the signal is; the smaller and blurrier the eye diagram is, the worse the signal is.
So how do you generate an eye diagram? It is actually very simple, just synchronise the horizontal scanning period of the oscilloscope with the period of the received code elements, so that each code element will be repeatedly displayed in the same position, thus forming an eye diagram. Of course, here you need to pay attention to some details, such as the oscilloscope's sampling rate, trigger mode, bandwidth, etc..
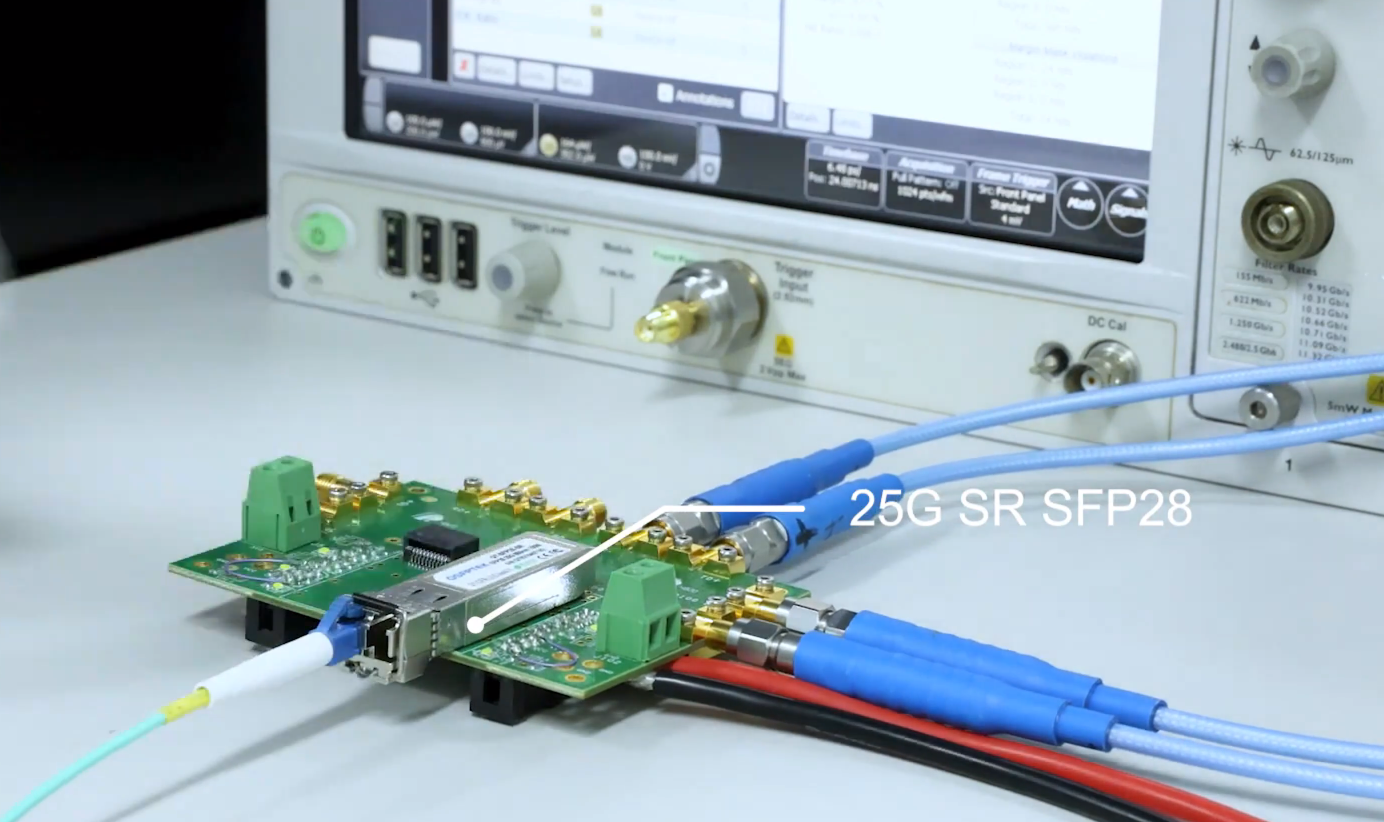
In this article, we will take the 25G optical module as an example to introduce the method of generating and analysing eye diagrams.25G optical module is a high-speed and low-power optical module, which adopts the SFP28 interface and supports a data transmission rate of 25Gbps.25G optical modules are widely used in data centres, cloud computing, 5G networks and other fields.
25G Optical Module Eye Diagram Generation
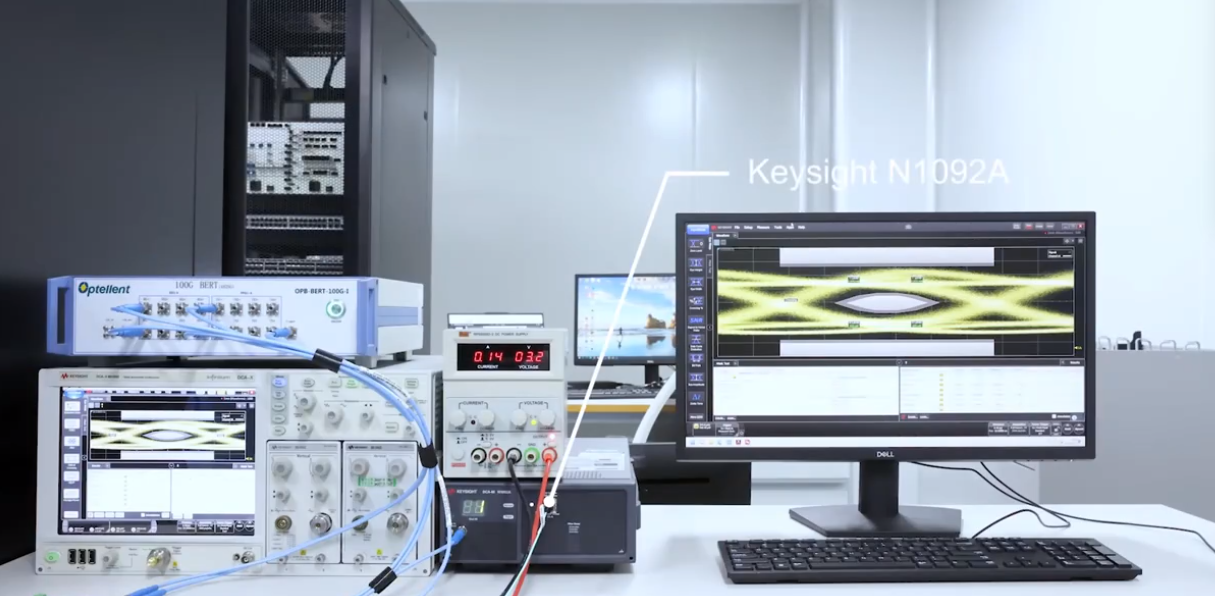
To generate a 25G optical module eye diagram, we need to prepare the following equipment:
- An oscilloscope that supports sampling rate, bandwidth, and trigger functions above 25Gbps.
- A BERT (Bit Error Rate Tester) that supports 25Gbps or higher data generation and BER testing.
- A suitable length and type of fibre optic patch cable.
- A 25G optical module to be tested
The specific steps are as follows:
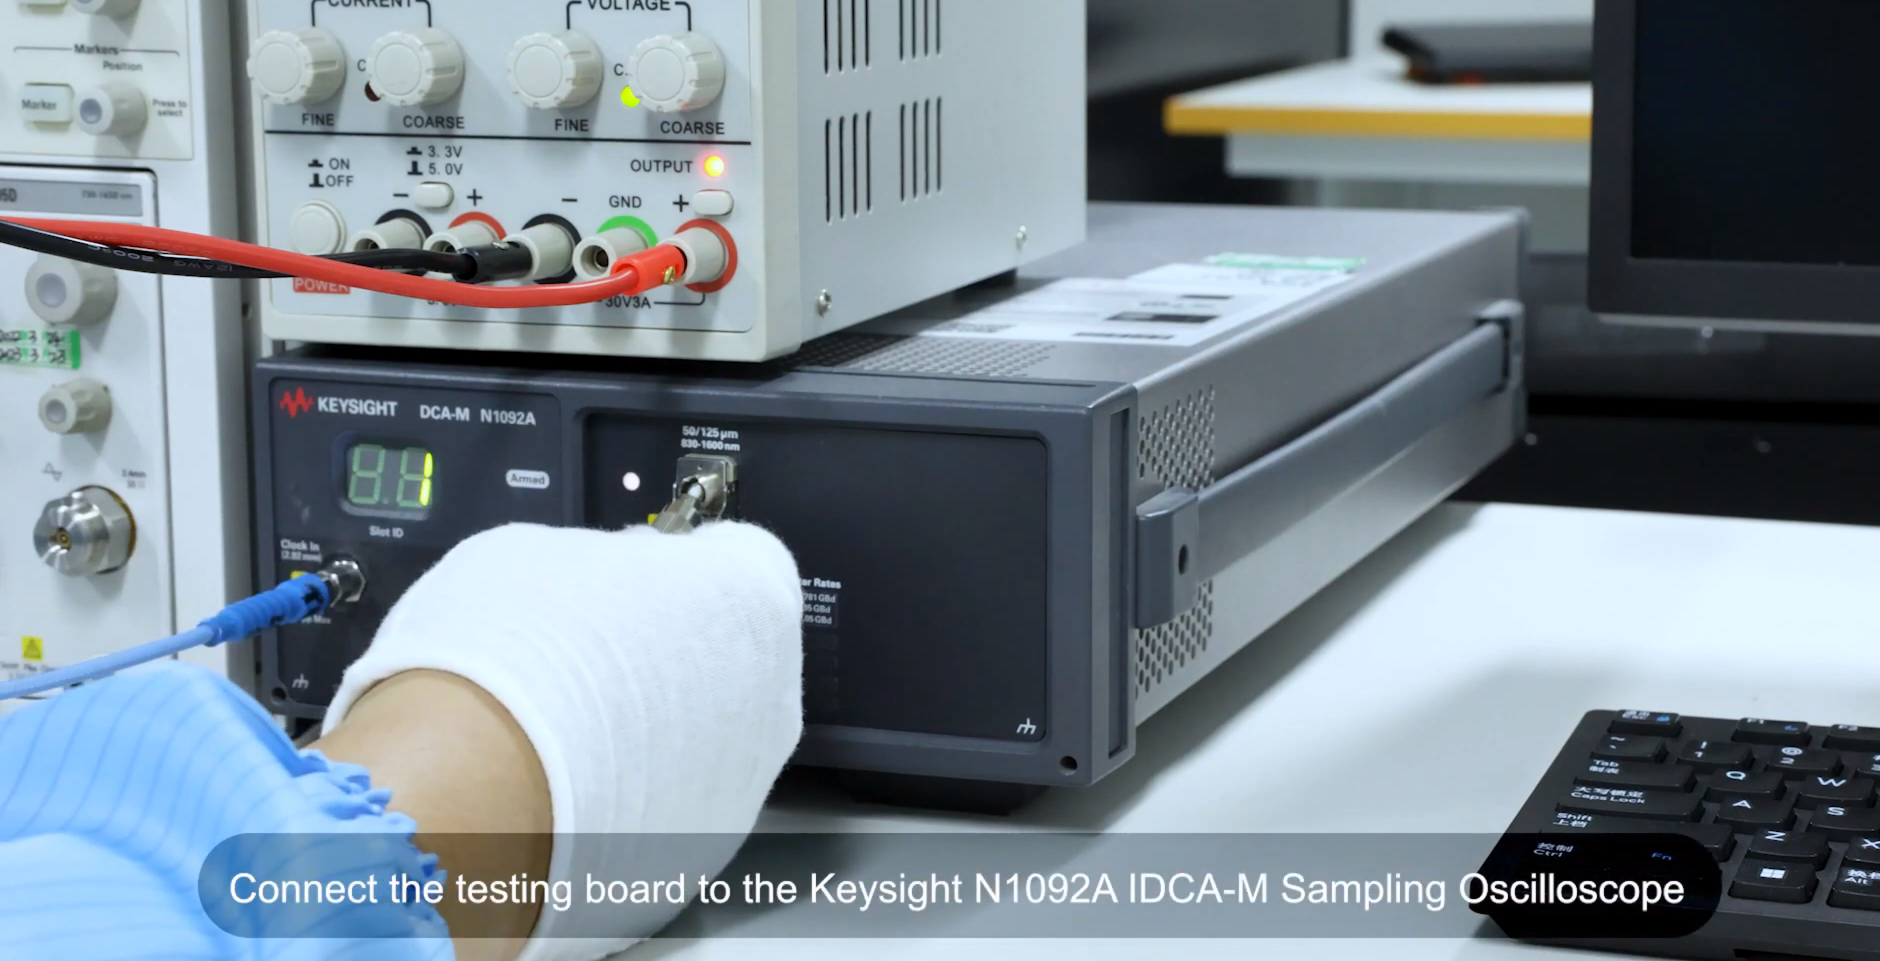
1. Connect the BERT to the oscilloscope and set up the corresponding parameters, such as data rate, data format, BER, etc.
2. Insert the 25G optical module to be tested into the BERT and connect it to the oscilloscope via a fibre optic patch cable.
3. Set up the horizontal scanning period on the oscilloscope to be the same as the period of the received code element, and select the appropriate trigger mode and level.
4. Observe and save the eye diagram on the oscilloscope.
25G Optical Module Eye Diagram Analysis
After generating a 25G optical module eye diagram, we can analyse it. There are two main objectives of analysing the eye diagram: first, to check whether there are obvious errors or anomalies; second, to measure and calculate some important parameters. The following are some common methods of analysis:
- Check if there are obvious closures or openings in the eye diagram, if there are, it means that there is serious distortion or interference in the signal, which may lead to data loss or error.
- Check the eye diagram for significant noise or jitter, if so, this indicates a large fluctuation or instability in the signal which may affect the quality and performance of the signal.
- Measure the opening height and width of the eye diagram, which indicate the level difference and duration of the signal respectively, reflecting the amplitude and time characteristics of the signal.
- Measure the cross point and cross point jitter of the eye diagram, which indicate the zero point and zero point fluctuation of the signal respectively, reflecting the phase and frequency characteristics of the signal.
- The extinction ratio and signal-to-noise ratio of the measurement eye diagram indicate the contrast and clarity of the signal, respectively, reflecting the strength and quality characteristics of the signal.
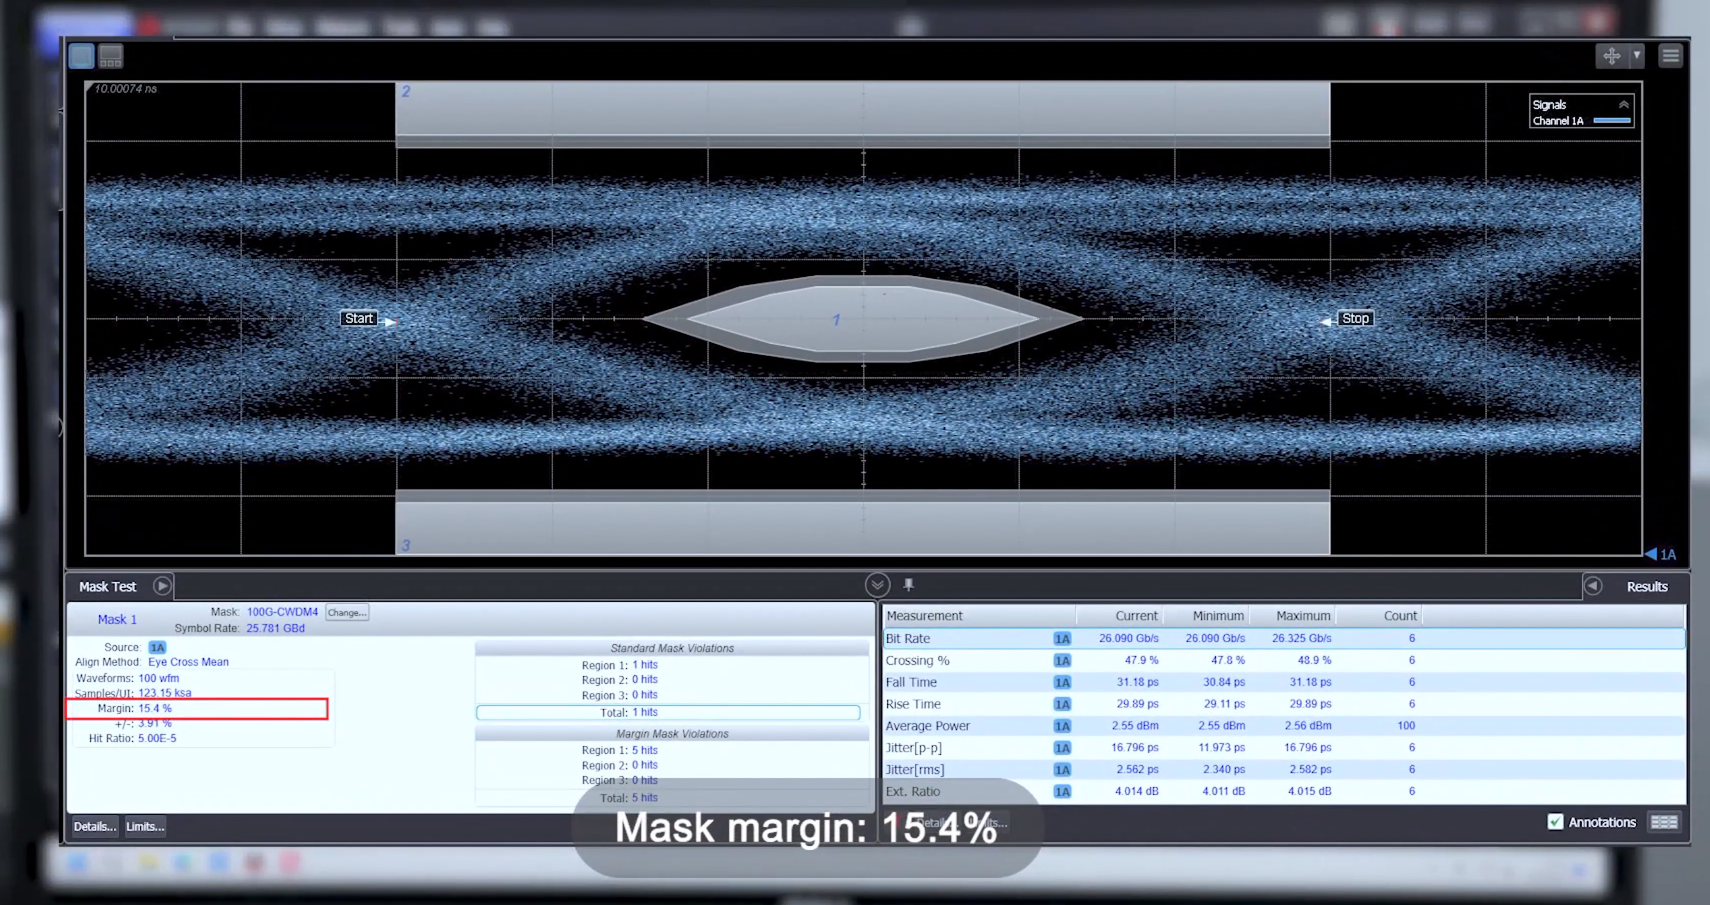
These are some basic eye diagram analysis methods, of course, there are some more advanced methods, such as eye diagram mask, eye diagram level, eye diagram edge, etc., which can more accurately assess the performance and fault tolerance of the signal.
Through this paper, we understand the working principle, generation method and analysis method of 25G optical module eye diagram. We learned that the eye diagram is a very effective tool to help us quickly assess the performance and quality of an optical module. Of course, the eye diagram is just a reference, and more experiments and verification are needed to really test the performance and quality of an optical module. Hope this article is helpful to you!
Optical module is an indispensable component in the optical fibre communication system, which is responsible for converting electrical signals into optical signals or optical signals into electrical signals, so as to achieve the transmission of data. With the development of communication technology, the rate of optical modules is also increasing, from the initial hundreds of megabits per second to the current dozens or even hundreds of gigabits per second, the performance requirements of optical modules are also getting higher and higher. So, how to evaluate the performance of an optical module? Is there a simple and effective method? The answer is yes, that is eye diagram.
Eye diagram is a tool used to observe the quality and performance of high-speed digital signals, which can reflect a lot of information about the signal, such as noise, jitter, inter-code crosstalk, extinction ratio, signal-to-noise ratio and so on. Eye diagram is a series of digital signals accumulated on the oscilloscope and displayed graphics, it is similar to the shape of an eye, hence the name. The size and clarity of the eye diagram can reflect the quality of the signal. Generally speaking, the larger and clearer the eye diagram is, the better the signal is; the smaller and blurrier the eye diagram is, the worse the signal is.
So how do you generate an eye diagram? It is actually very simple, just synchronise the horizontal scanning period of the oscilloscope with the period of the received code elements, so that each code element will be repeatedly displayed in the same position, thus forming an eye diagram. Of course, here you need to pay attention to some details, such as the oscilloscope's sampling rate, trigger mode, bandwidth, etc..
In this article, we will take the 25G optical module as an example to introduce the method of generating and analysing eye diagrams.25G optical module is a high-speed and low-power optical module, which adopts the SFP28 interface and supports a data transmission rate of 25Gbps.25G optical modules are widely used in data centres, cloud computing, 5G networks and other fields.
25G Optical Module Eye Diagram Generation
To generate a 25G optical module eye diagram, we need to prepare the following equipment:
- An oscilloscope that supports sampling rate, bandwidth, and trigger functions above 25Gbps.
- A BERT (Bit Error Rate Tester) that supports 25Gbps or higher data generation and BER testing.
- A suitable length and type of fibre optic patch cable.
- A 25G optical module to be tested
The specific steps are as follows:
1. Connect the BERT to the oscilloscope and set up the corresponding parameters, such as data rate, data format, BER, etc.
2. Insert the 25G optical module to be tested into the BERT and connect it to the oscilloscope via a fibre optic patch cable.
3. Set up the horizontal scanning period on the oscilloscope to be the same as the period of the received code element, and select the appropriate trigger mode and level.
4. Observe and save the eye diagram on the oscilloscope.
25G Optical Module Eye Diagram Analysis
After generating a 25G optical module eye diagram, we can analyse it. There are two main objectives of analysing the eye diagram: first, to check whether there are obvious errors or anomalies; second, to measure and calculate some important parameters. The following are some common methods of analysis:
- Check if there are obvious closures or openings in the eye diagram, if there are, it means that there is serious distortion or interference in the signal, which may lead to data loss or error.
- Check the eye diagram for significant noise or jitter, if so, this indicates a large fluctuation or instability in the signal which may affect the quality and performance of the signal.
- Measure the opening height and width of the eye diagram, which indicate the level difference and duration of the signal respectively, reflecting the amplitude and time characteristics of the signal.
- Measure the cross point and cross point jitter of the eye diagram, which indicate the zero point and zero point fluctuation of the signal respectively, reflecting the phase and frequency characteristics of the signal.
- The extinction ratio and signal-to-noise ratio of the measurement eye diagram indicate the contrast and clarity of the signal, respectively, reflecting the strength and quality characteristics of the signal.
These are some basic eye diagram analysis methods, of course, there are some more advanced methods, such as eye diagram mask, eye diagram level, eye diagram edge, etc., which can more accurately assess the performance and fault tolerance of the signal.
Through this paper, we understand the working principle, generation method and analysis method of 25G optical module eye diagram. We learned that the eye diagram is a very effective tool to help us quickly assess the performance and quality of an optical module. Of course, the eye diagram is just a reference, and more experiments and verification are needed to really test the performance and quality of an optical module. Hope this article is helpful to you!