


Range and standard deviation: Comparing stochastic models to the real world


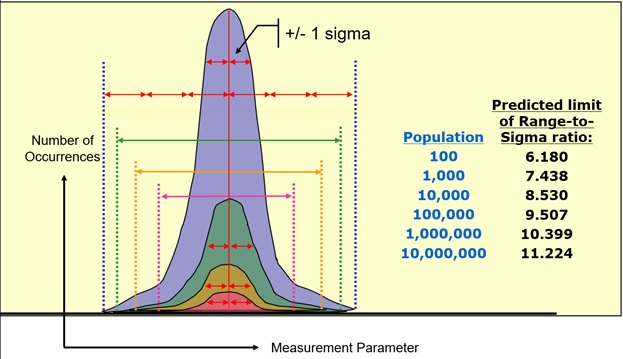
Figure 1: Limits on the ratio of histogram range to histogram distribution that can be predicted for a given overall size. The larger the overall size, the larger the ratio of peak-to-peak range to sigma.
To heuristically investigate the accuracy of statistical model predictions, we used a function generator and an oscilloscope to collect results for different sizes of measured parameters using a 3 MHz sine wave. The oscilloscope captured multiple acquisitions of the sine waveform and measured its cyclic frequency over 1,000 waveform cycles (see Figure 2). The oscilloscope also calculates the standard deviation (parameter P2) and the range (parameter P5) of the histogram.
Note that the ratio of the measured frequency to the sigma is close to 0.1%. The oscilloscope used in this experiment has a sampling clock jitter specification of 280 femtoseconds rms, which is negligible relative to the sinusoidal frequency variation. While a small fraction of the jitter noise comes from measurement errors generated by the oscilloscope, most of the random variation from peak to sigma frequency of the sine wave measurement is due to the quality of the relatively low accuracy function generator.
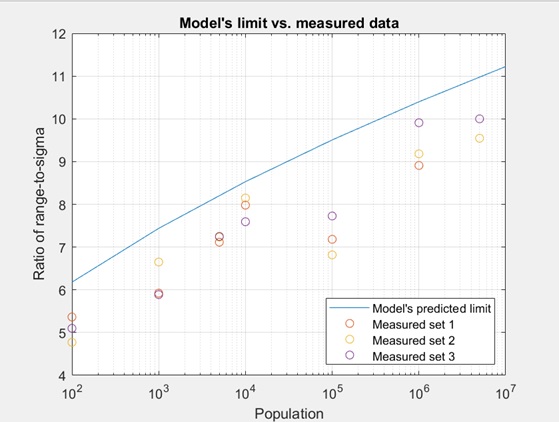
Figure 2: Histogram of a collection of 1,000 frequency measurements. Parameter P1 calculates the signal frequency. p2 and p5 calculate the standard deviation and range of the histogram distribution.
A larger total of 5,000,000 values was collected, as shown in Figure 3. The Gaussian shape of the random frequency fluctuations appears in this more statistically significant histogram. Since the results differ for each data set, a series of three test tours will be performed and tabulated for each overall size.
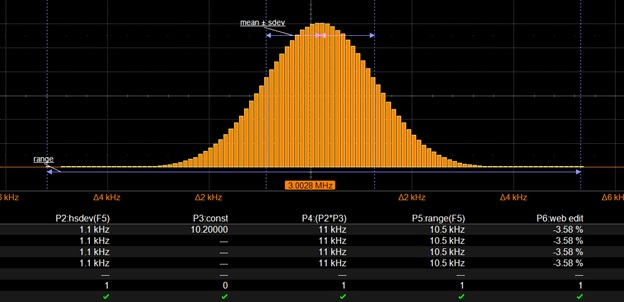
Figure 3: A statistically significant histogram was collected for a larger group including 5,000,000 cycle frequency measurements, and the results confirm a larger range with the sigma ratio.
Figure 4 compares the experimental results to the model using a semi-log plot. The blue line in Figure 4 plots the predicted model values originally given in Figure 1. The experimental results for the three test runs are plotted as the orange, yellow, and purple circles shown in the figure.
Figure 4: Prediction model in Figure 1 (blue line) and experimental results (orange, yellow and purple circles). The experimental results confirm that the model is an accurate predictor of the range to the sigma value limit at different overall sizes.
The model prediction range to sigma ratio limit scales as the population increases - for example, the ratio increases from 399.1 to 000.1 as the population increases from 7,438 to 100,000. this is also confirmed in the lab using data collected from the oscilloscope, supporting that the model is indeed a good predictor of real-world measurement results. This is important for many signal integrity measurement applications that rely on extrapolation of subsets of data to predict system behavior. For example, the probability of an edge arrival may be one in a billion, resulting in an electronic failure in a latching system. By referring to models that correlate sigma with peak-to-peak values, signal integrity engineers can predict the likelihood and severity of worst-case system behavior.
Figure 1: Limits on the ratio of histogram range to histogram distribution that can be predicted for a given overall size. The larger the overall size, the larger the ratio of peak-to-peak range to sigma.
To heuristically investigate the accuracy of statistical model predictions, we used a function generator and an oscilloscope to collect results for different sizes of measured parameters using a 3 MHz sine wave. The oscilloscope captured multiple acquisitions of the sine waveform and measured its cyclic frequency over 1,000 waveform cycles (see Figure 2). The oscilloscope also calculates the standard deviation (parameter P2) and the range (parameter P5) of the histogram.
Note that the ratio of the measured frequency to the sigma is close to 0.1%. The oscilloscope used in this experiment has a sampling clock jitter specification of 280 femtoseconds rms, which is negligible relative to the sinusoidal frequency variation. While a small fraction of the jitter noise comes from measurement errors generated by the oscilloscope, most of the random variation from peak to sigma frequency of the sine wave measurement is due to the quality of the relatively low accuracy function generator.
Figure 2: Histogram of a collection of 1,000 frequency measurements. Parameter P1 calculates the signal frequency. p2 and p5 calculate the standard deviation and range of the histogram distribution.
A larger total of 5,000,000 values was collected, as shown in Figure 3. The Gaussian shape of the random frequency fluctuations appears in this more statistically significant histogram. Since the results differ for each data set, a series of three test tours will be performed and tabulated for each overall size.
Figure 3: A statistically significant histogram was collected for a larger group including 5,000,000 cycle frequency measurements, and the results confirm a larger range with the sigma ratio.
Figure 4 compares the experimental results to the model using a semi-log plot. The blue line in Figure 4 plots the predicted model values originally given in Figure 1. The experimental results for the three test runs are plotted as the orange, yellow, and purple circles shown in the figure.
Figure 4: Prediction model in Figure 1 (blue line) and experimental results (orange, yellow and purple circles). The experimental results confirm that the model is an accurate predictor of the range to the sigma value limit at different overall sizes.
The model prediction range to sigma ratio limit scales as the population increases - for example, the ratio increases from 399.1 to 000.1 as the population increases from 7,438 to 100,000. this is also confirmed in the lab using data collected from the oscilloscope, supporting that the model is indeed a good predictor of real-world measurement results. This is important for many signal integrity measurement applications that rely on extrapolation of subsets of data to predict system behavior. For example, the probability of an edge arrival may be one in a billion, resulting in an electronic failure in a latching system. By referring to models that correlate sigma with peak-to-peak values, signal integrity engineers can predict the likelihood and severity of worst-case system behavior.