


With the development of society and technological innovation, the latest optical fiber interface has FC interface, ST interface, SC interface, then how to verify the optical interface performance, whether it meets the relevant standard requirements?
Wavelength range: 600~1700nm
High wavelength accuracy: ±0.01nm
High wavelength resolution: 0.02nm
Large dynamic range: 78dB(typical value)
Wide power range: +20~-90dBm
Fast measurement: 0.2 seconds (100nm span)
Suitable for single mode and multi-mode fiber

Verify the optical interface performance of the AQ6370D spectral analyzer, and whether it meets the relevant standards:
The operation method is as follows:
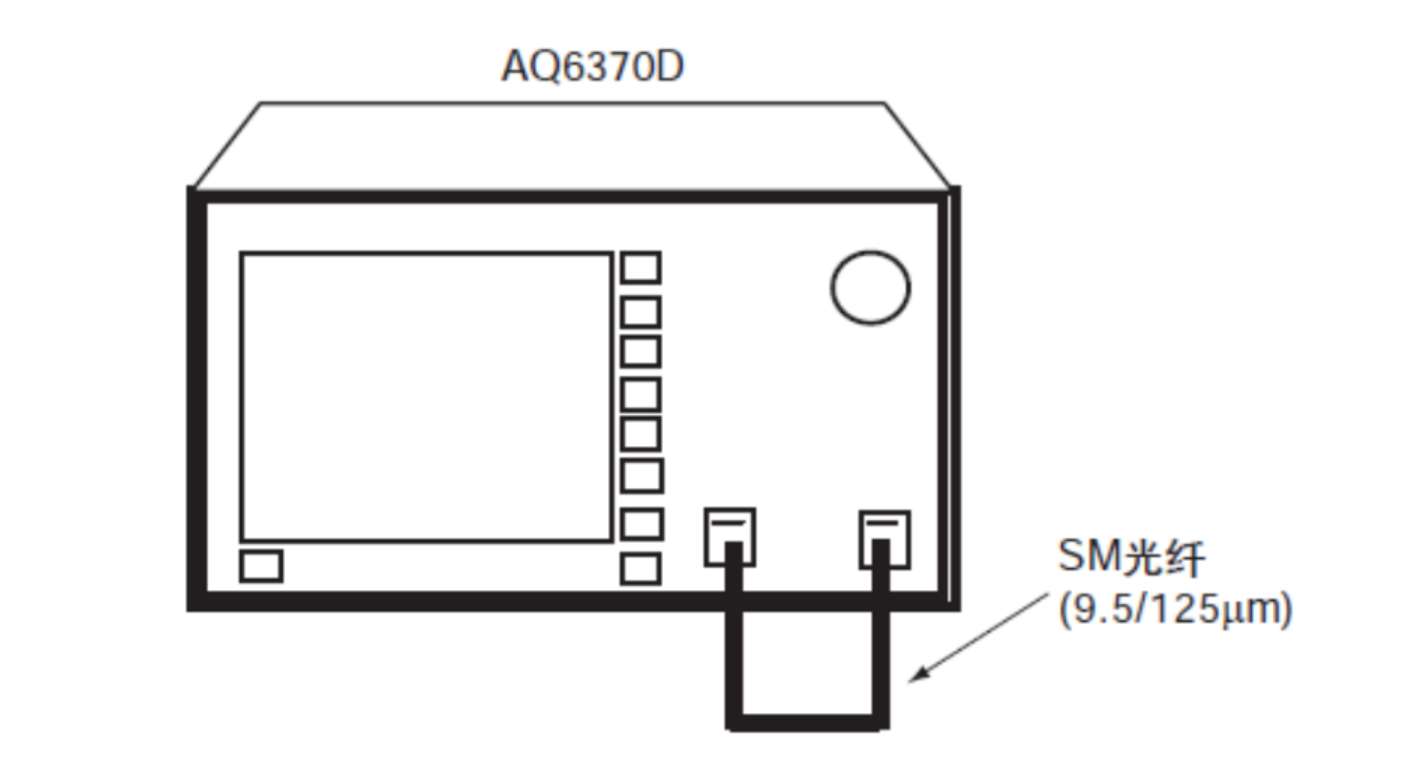
AQ6370D boot calibration, turn on the power,FC-FC interface optical fiber to connect the AQ6370D optical input connector and optical output connector, as shown in the figure.
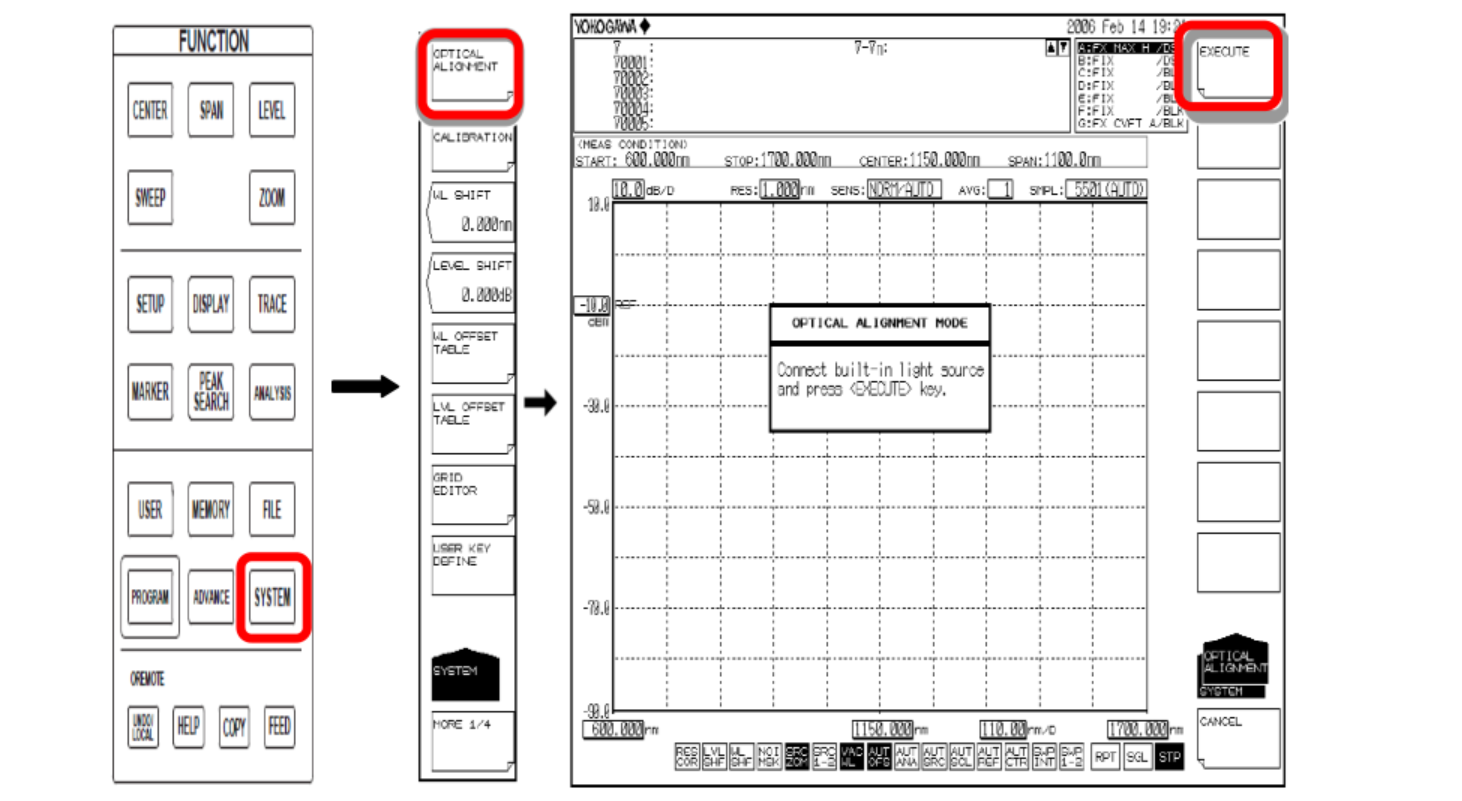
2. Adjust alignment using an internal reference light source
① According to SYSTEM OPTICAL ALIGNMENT
② Press EXECUTE soft key to automatically execute alignment adjustment. After a few minutes, the alignment adjustment ends and the instrument returns to the previous screen.
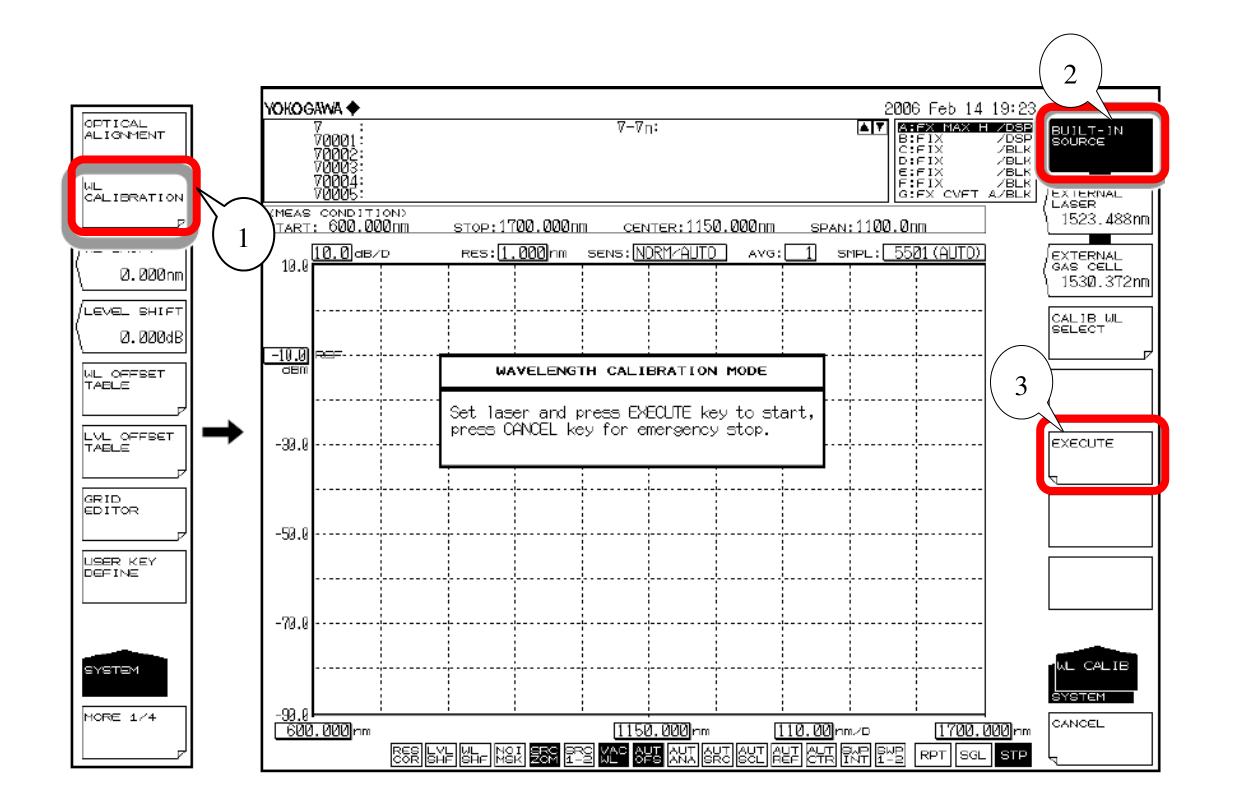
3. Wavelength calibration with built-in reference light source
① Press the SYSTEM WL CALIBRATION softkey.
② Press the BUILT-IN SOURCE soft key.
③ Press the EXECUTE soft key to perform wavelength calibration. After calibration, return to the previous screen.
Test condition setting
1, after the calibration is completed, automatic scanning, automatic adjustment of resolution, get the approximate range of wavelength and power.
① Press the SWEEP AUTO soft key to perform automatic measurement.
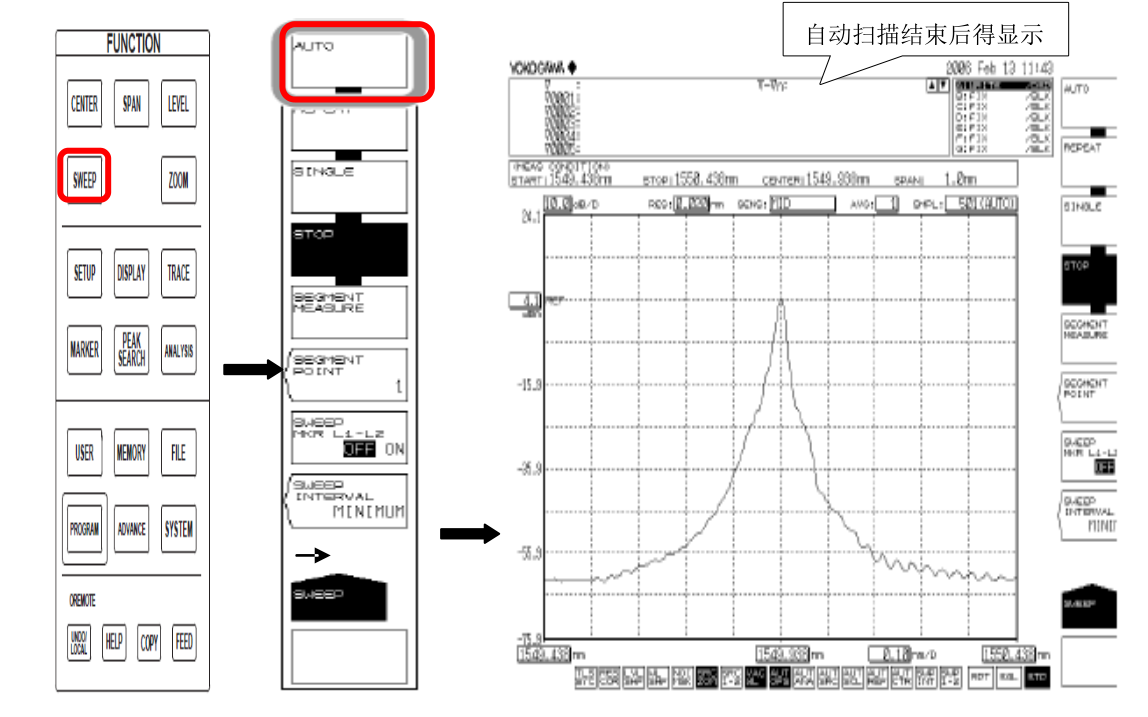
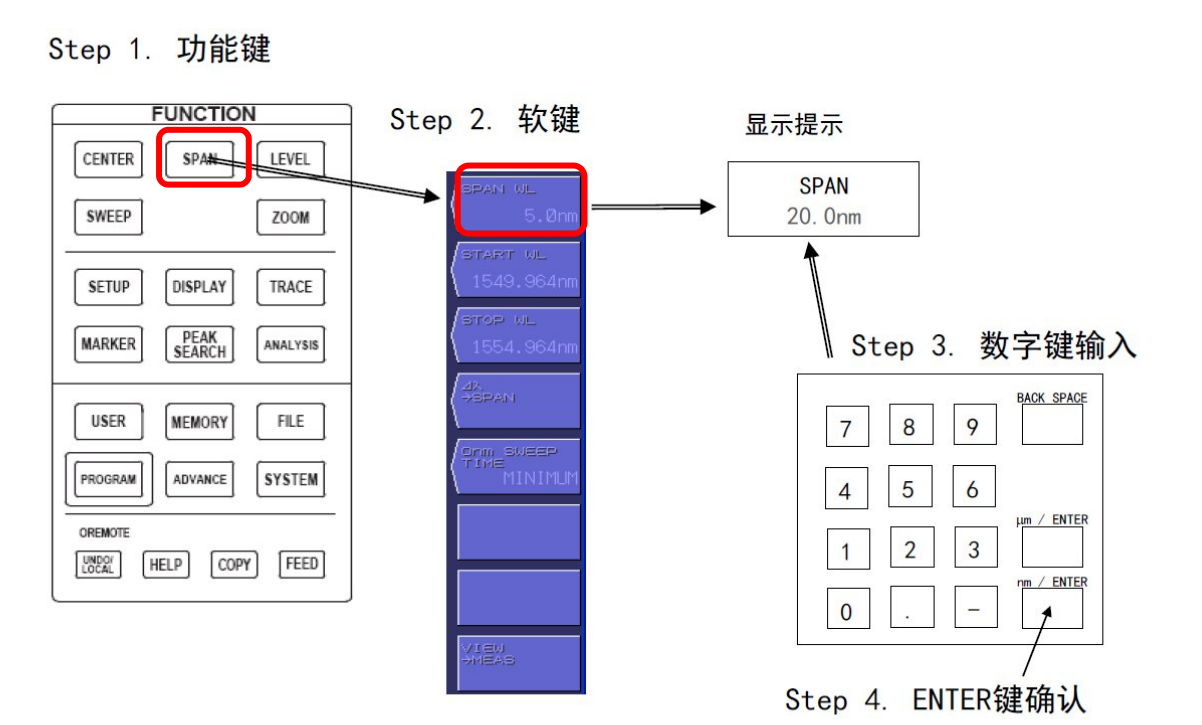
② Set the scanning range and press SPAN.
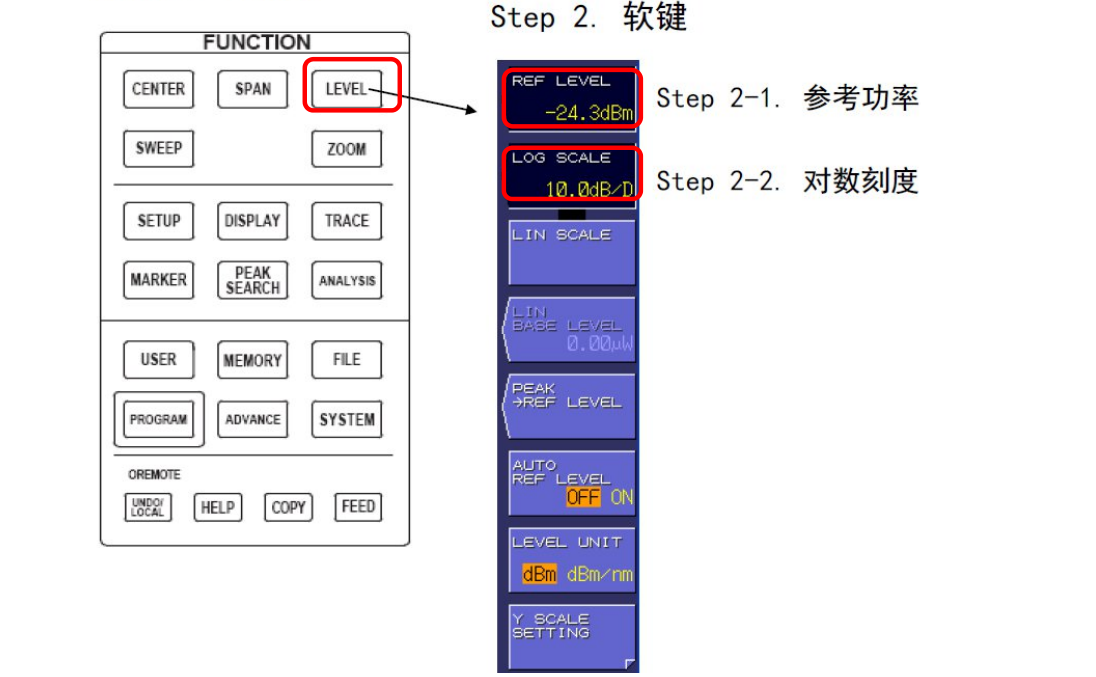
③ Set the reference power and scale, press the LEVEL key, the reference power is set to -3dBm, which is the default value.
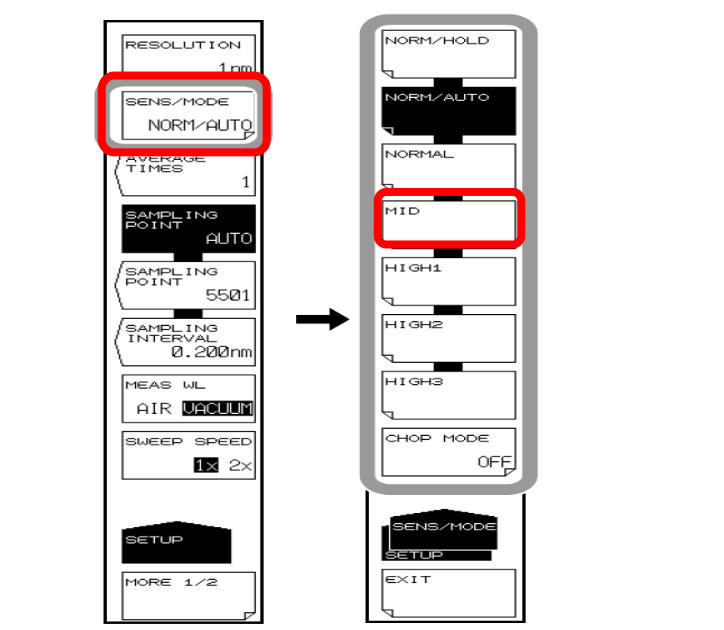
④ Press the SETUP key to set the resolution to the highest precision 0, 02nm.

⑤ Set sensitivity, mode is MID, and other conditions are default values.
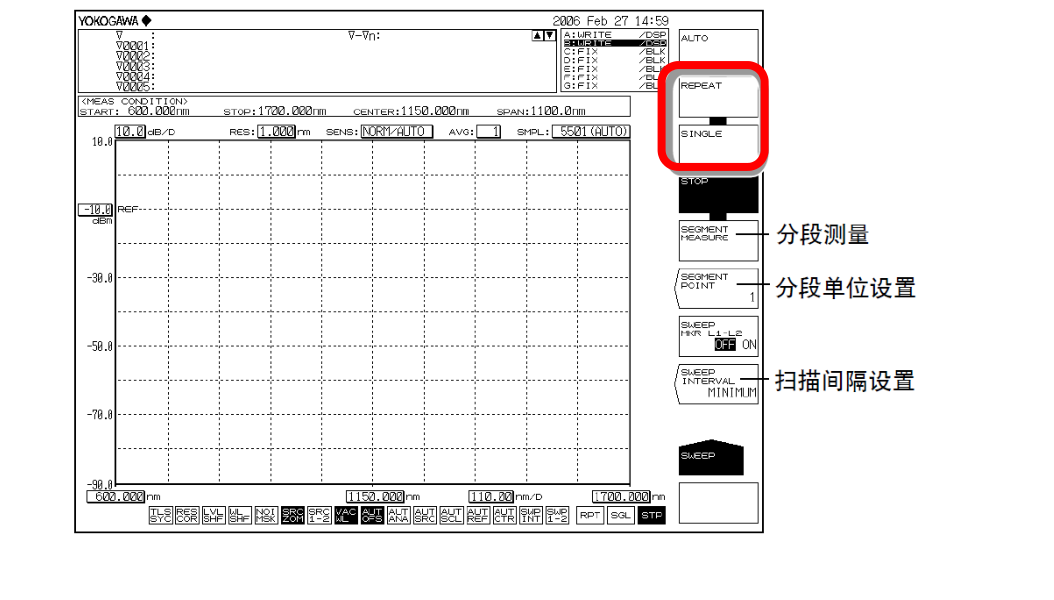
⑥Set up and start the test, execute REPEAT repeat scan or SINGLE single scan 5~10 times, then press STOP key, analyze and record the data.
Analysis: After the photocat is powered on, it is directly connected to the test topology after using the script long light.
1、 DFB-LD, FP-LD light source analysis
① Press ANALYSIS to display the softkey menu related to the measurement waveform analysis
② Press ANALYSIS 1 softkey to display the analysis function selection menu.
Take the GPON prototype as an example, select DFB-LD as the light source type, perform the analysis, and the results are displayed in the data area.
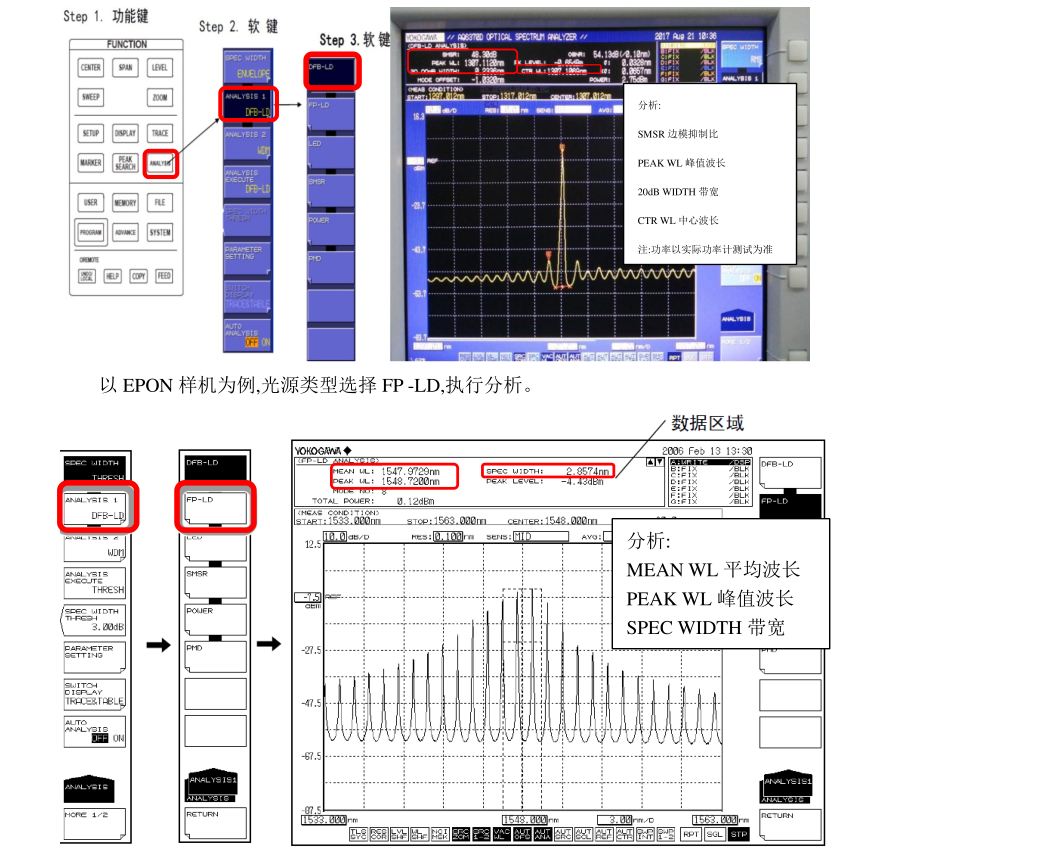
Note: When analyzing the FP-LD light source, the SPEC WIDTH in the data area is measured to be 3dB bandwidth, which is related to the K factor, when K=1,SPEC
WIDTH is the original bandwidth; When K=2, the SPEC WIDTH is the corrected value and should be changed according to actual needs.
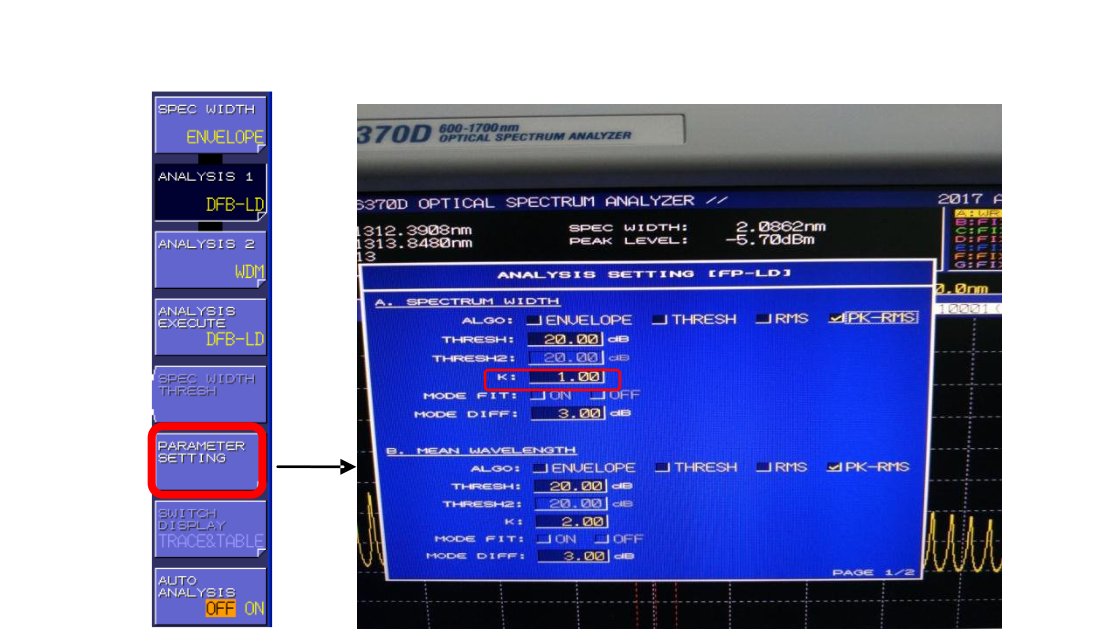
Perform the following operations to change the K value: press the SYSTEM key, PARAMETER SETTING key, and select the K value by rotating the keyboard input
Change, press the CLOSE WINDOW key to start retesting
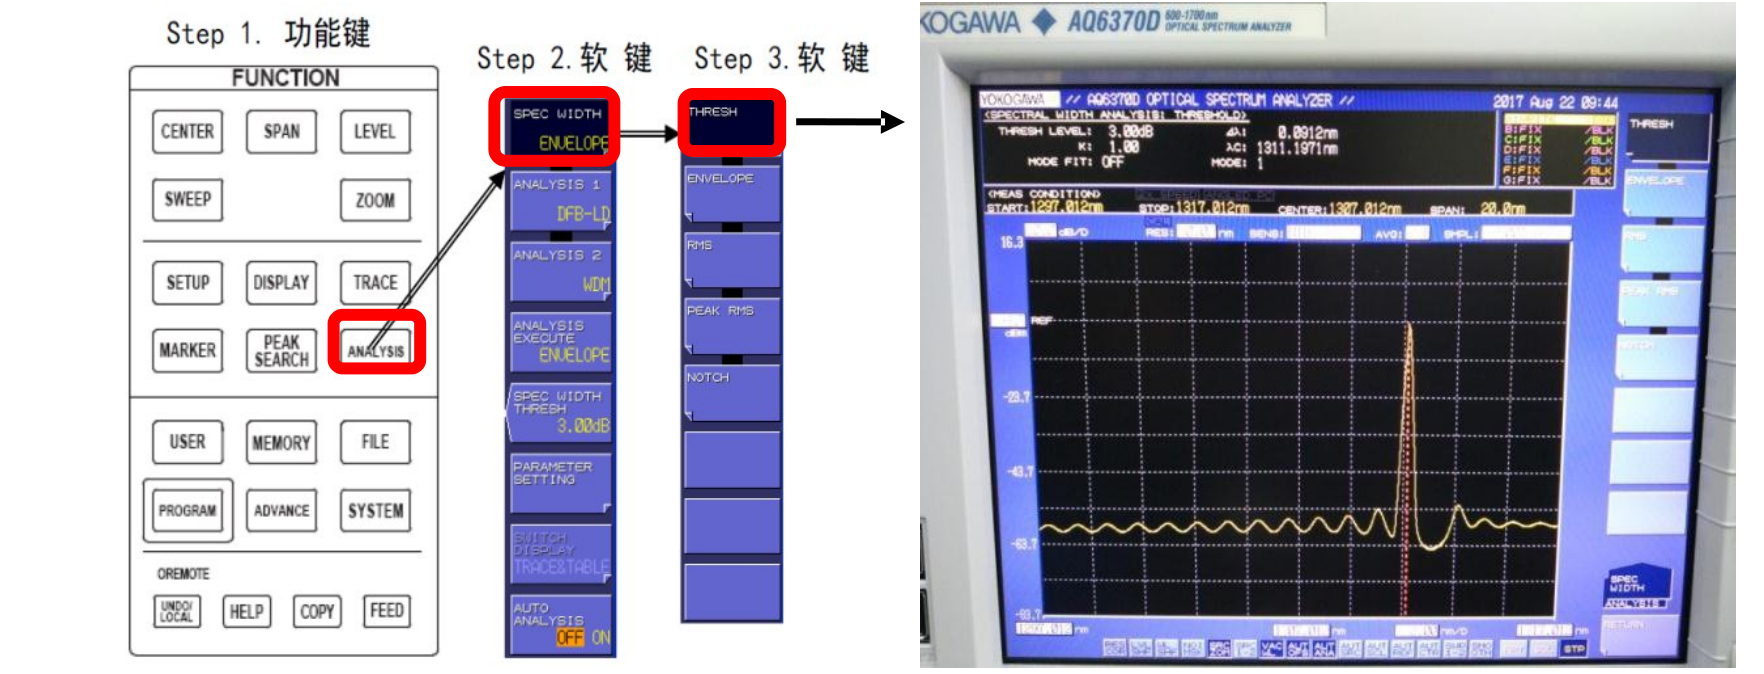
Spectral width measurement
1. 3dB spectrum width
2. RMS spectrum width (for FP-LD light source)
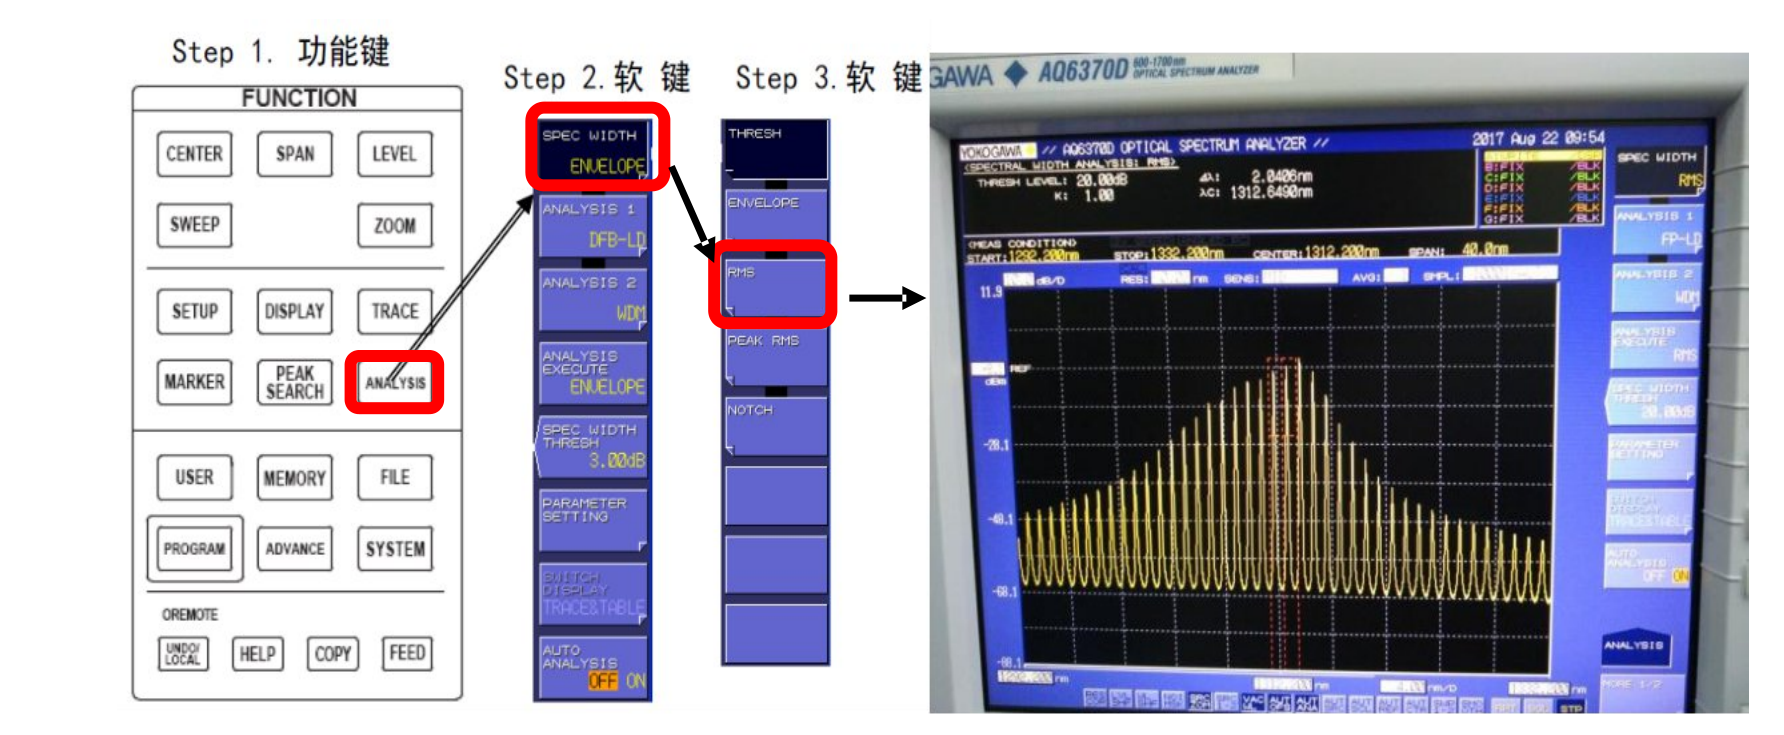
Save data: Save the measurement data to the external memory USB disk, the file type is GRAPHIC:
Press FILE ITEM SELECT soft key,GRAPHIC soft key,GRAPHIC is selected and returns to the upper screen, press WRITE soft key to display text
File list MEMORY, select EXT, enter the file name, run DONE, and then run EXCUTE
With the development of society and technological innovation, the latest optical fiber interface has FC interface, ST interface, SC interface, then how to verify the optical interface performance, whether it meets the relevant standard requirements?
Wavelength range: 600~1700nm
High wavelength accuracy: ±0.01nm
High wavelength resolution: 0.02nm
Large dynamic range: 78dB(typical value)
Wide power range: +20~-90dBm
Fast measurement: 0.2 seconds (100nm span)
Suitable for single mode and multi-mode fiber
Verify the optical interface performance of the AQ6370D spectral analyzer, and whether it meets the relevant standards:
The operation method is as follows:
AQ6370D boot calibration, turn on the power,FC-FC interface optical fiber to connect the AQ6370D optical input connector and optical output connector, as shown in the figure.
2. Adjust alignment using an internal reference light source
① According to SYSTEM OPTICAL ALIGNMENT
② Press EXECUTE soft key to automatically execute alignment adjustment. After a few minutes, the alignment adjustment ends and the instrument returns to the previous screen.
3. Wavelength calibration with built-in reference light source
① Press the SYSTEM WL CALIBRATION softkey.
② Press the BUILT-IN SOURCE soft key.
③ Press the EXECUTE soft key to perform wavelength calibration. After calibration, return to the previous screen.
Test condition setting
1, after the calibration is completed, automatic scanning, automatic adjustment of resolution, get the approximate range of wavelength and power.
① Press the SWEEP AUTO soft key to perform automatic measurement.
② Set the scanning range and press SPAN.
③ Set the reference power and scale, press the LEVEL key, the reference power is set to -3dBm, which is the default value.
④ Press the SETUP key to set the resolution to the highest precision 0, 02nm.
⑤ Set sensitivity, mode is MID, and other conditions are default values.
⑥Set up and start the test, execute REPEAT repeat scan or SINGLE single scan 5~10 times, then press STOP key, analyze and record the data.
Analysis: After the photocat is powered on, it is directly connected to the test topology after using the script long light.
1、 DFB-LD, FP-LD light source analysis
① Press ANALYSIS to display the softkey menu related to the measurement waveform analysis
② Press ANALYSIS 1 softkey to display the analysis function selection menu.
Take the GPON prototype as an example, select DFB-LD as the light source type, perform the analysis, and the results are displayed in the data area.
Note: When analyzing the FP-LD light source, the SPEC WIDTH in the data area is measured to be 3dB bandwidth, which is related to the K factor, when K=1,SPEC
WIDTH is the original bandwidth; When K=2, the SPEC WIDTH is the corrected value and should be changed according to actual needs.
Perform the following operations to change the K value: press the SYSTEM key, PARAMETER SETTING key, and select the K value by rotating the keyboard input
Change, press the CLOSE WINDOW key to start retesting
Spectral width measurement
1. 3dB spectrum width
2. RMS spectrum width (for FP-LD light source)
Save data: Save the measurement data to the external memory USB disk, the file type is GRAPHIC:
Press FILE ITEM SELECT soft key,GRAPHIC soft key,GRAPHIC is selected and returns to the upper screen, press WRITE soft key to display text
File list MEMORY, select EXT, enter the file name, run DONE, and then run EXCUTE

