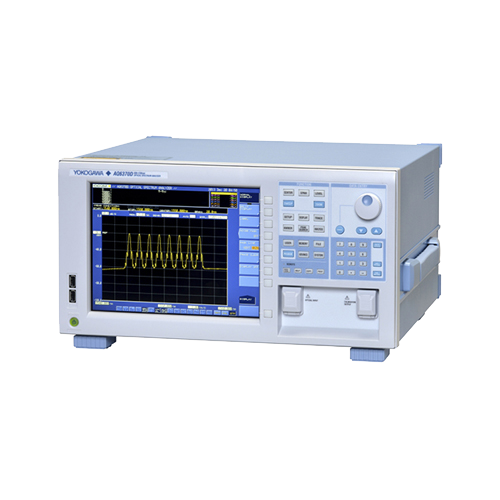
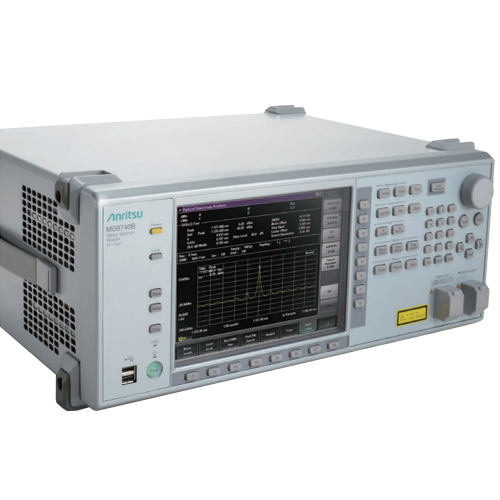
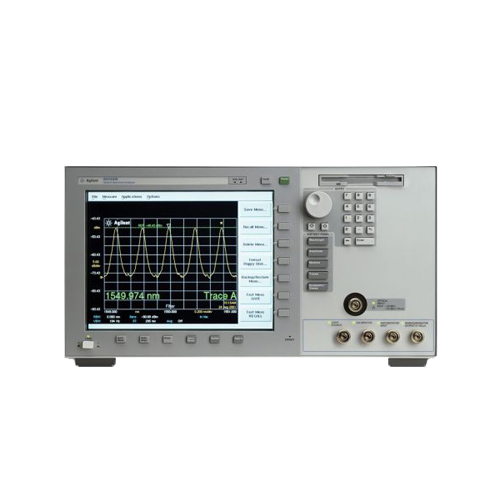
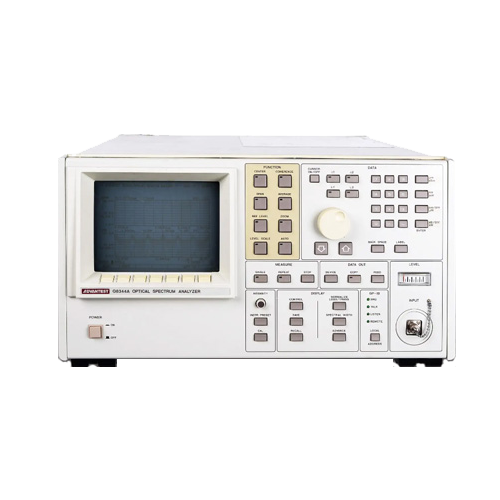
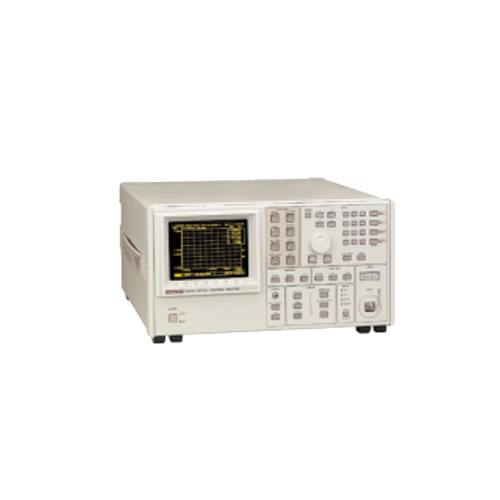
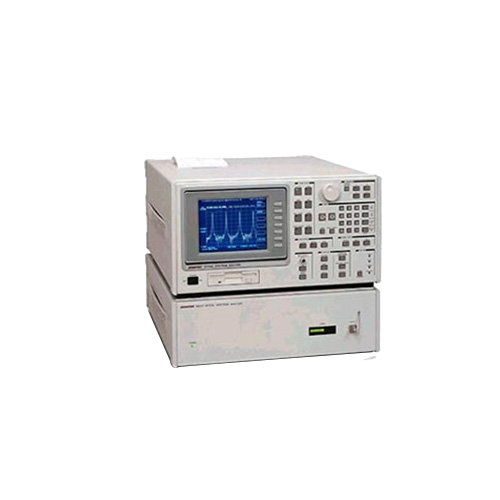
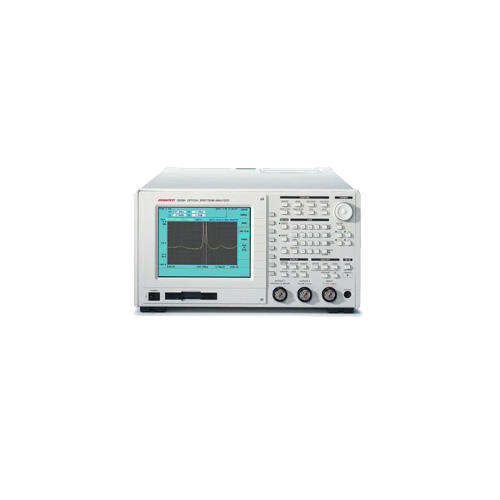
Enables measurement and evaluation of ultra-high speed optical DWDM transmission systems and optical components at high wavelength resolution and high accuracy The new high-end optical spectrum analyzer uses a new four-pass monochromator system that provides high wavelength resolution and wide dynamic range.
The Q8384 optical spectrum analyzer evaluates these specifications with enhanced resolution bandwidth, wavelength accuracy, and stringent wavelength measurement requirements in DWDM optical communication light sources. Best in the world the Q8384 achieves 10 points of wavelength resolution and 20 points of wavelength accuracy in the 1550nm band. Such high performance makes it possible for the Q8384 to measure the oscillation wavelength characteristics of laser diodes accurately. DWDM optical communication systems also contain wavelength splitting multiplexing
The channel spacing is as close as possible to the time interval of 50 GHz (0.4 nm).
An optical spectrum analyzer with excellent dynamic range in such an environment is required to separate the optical signal and measure the noise factor (NF) of the optical amplifier. 0.1 nm has a wide dynamic range of 50 dB to 60 dB at 0.2 nm, and therefore fully meets these requirements. Equipped with automatic optical amplifier NF measurement and arithmetic facilities, allowing the user to perform measurements in a simple manner.
Optionally has a built-in reference wavelength light source and an EE-LED (edge emission LED). If the Q8384 is calibrated with a reference light source, the instrument is guaranteed to provide wavelength accuracy in the 1550 nm band by 20 PM. The use of the EE-LED broadband light source enables the user to easily measure and evaluate the loss characteristics of its transmission and narrowband optical filters. By employing a newly developed monochromator system, the wavelength resolution bandwidth is achieved as highas 10 pm. This makes it possible to measure and evaluate the intensity modulation of its sideband optical signals at 10 Gbps, a task previously impossible with conventional spectrum analyzers.
The accuracy can be measured to ±20 when the wavelength is within the wavelength range of 1530 to 1570 nm in the C-band, and within ±40 points in the L-band for the range of one thousand five hundred seven to 1610 nm after calibration with the built-in calibration light source (option 25). The button enables high accuracy of noise coefficient measurement, which can be enhanced by the performance of dynamic range, polarization correlation, level accuracy, linearity, wavelength resolution setting accuracy, etc., and applying functions such as curve fitting.
The DWDM signal can be accurately determined for time intervals of 50 GHz (0.4 nm) or narrower complex ASE levels, which provides the ability to not only perform accurate noise figure measurements, but also to display a list of multiple measurement results at the same time. It can display the power level of WDM signals with a maximum of 256 peak wavelengths. It can display wavelengths and power levels from the ITU-T channel interval, or from a reference signal, as well as deviations in absolute values.
Two sets of measurement data can be displayed in two windows with different setting conditions. These windows are erasable using the alternate scan function. With this feature, users can perform detailed measurements of signals in a specific wavelength band while monitoring the WDM system in the entire wavelength region. Supports long-range transmission loop testing using an external simultaneous scan function. It can measure very weak signals satisfactorily, as it has a high sensitivity of about -65 dBm. In addition, the pulse scan function makes it possible to measure the peak value of the measured light.
Even pulsed light can be measured without missing any part. Supports cascade display of up to 32 traces, which allows simultaneous display of multiple channels of mobile device characteristics, such as from AWG. Allows DWDM system monitoring. It is possible to continuously monitor whether the peak wavelength, the level of each channel, and the signal-to-noise ratio fluctuations are within their respective tolerances. Alternatively, it is possible to simultaneously display the current value relative to the initial value, the value of the first channel, the reference value, and the absolute value of the display. The maximum value, minimum value, and current value of the waveform can be displayed simultaneously for each measurement with repeated sweeps. The Q8384 can store data in text and bitmap formats with a built-in standard floppy disk drive.


