Discover the hidden features of the Yokogawa AQ6370E series spectrometer! ---Advanced Marking Function!
Yokogawa AQ6370E series spectrometer of this spectrometer's traditional functions, in fact, also hides a particularly useful function - advanced marking function! Unprecedented way to analyze data and measurement signals, not only brings a new test experience, but also improve the speed of measurement, so how to find this function, today we take a look at it!
Advanced Marker Function
The Advanced Marker Function is a function that allows users to easily obtain the power density and integrated power of a given spectrum by adding specific markers. This innovative design not only allows users to get rid of signal modulation, but also directly from the spectrum to obtain the OSNR (optical signal/noise ratio) value of the hope of becoming a reality; at the same time, it is also the field of optical communications, fiber optic sensing and spectral analysis of the engineers to quickly and accurately assess the signal quality, optimize the performance of the system is a good helper. The following is an introduction to the most commonly used power spectral density markers and integral power markers among the advanced markers.
Power Spectral Density Marker
Power Spectral Density Marker is a function that displays each power value within the normalized bandwidth setting range of 0.1nm ~ 10.0nm into the data area centered on the marker position on the waveform. When measuring the noise power of a signal, the user can use these markers to calculate the power value corresponding to each set bandwidth.
The operation procedure is shown below:
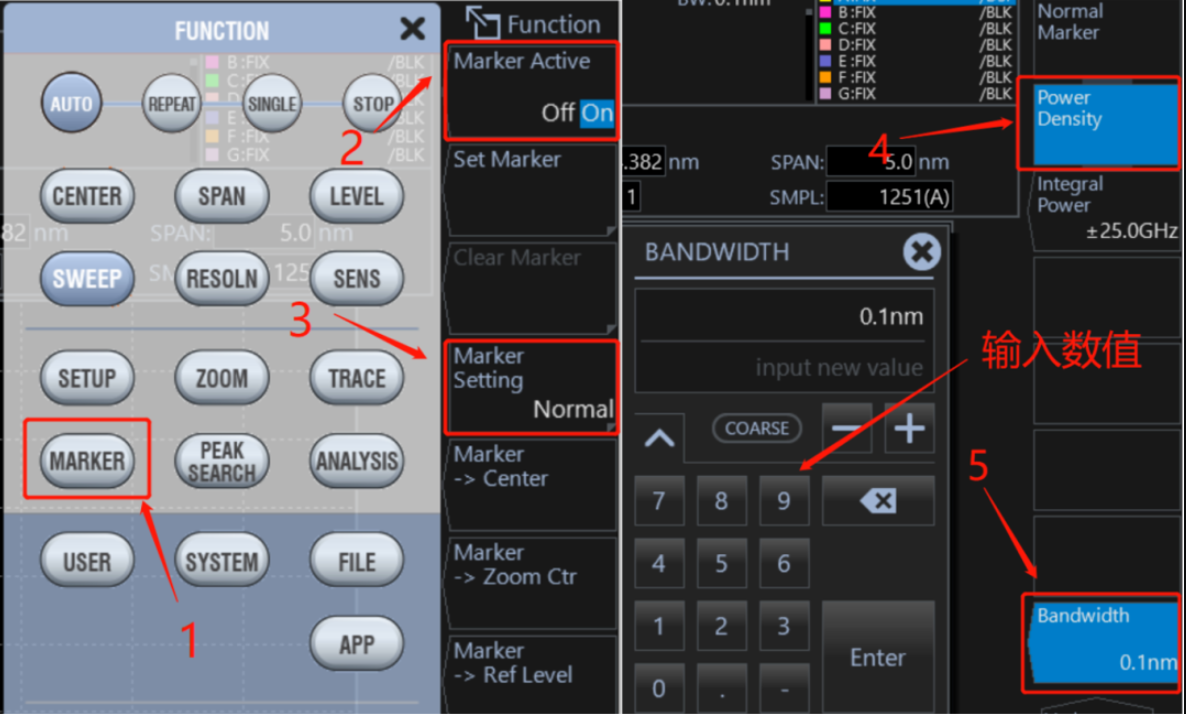
▲Flowchart of Power Spectral Density Marker Function
① Click the MARKIET button and set markit Active to ON;
② Click ,  and select Power Density option;
① Click MARKIET button to set the markit Active to ON; ② Click and select Power Density option; ③ Set the normalized bandwidth through the pop-up BANDWIDTH input box, the interface is shown in the following figure.
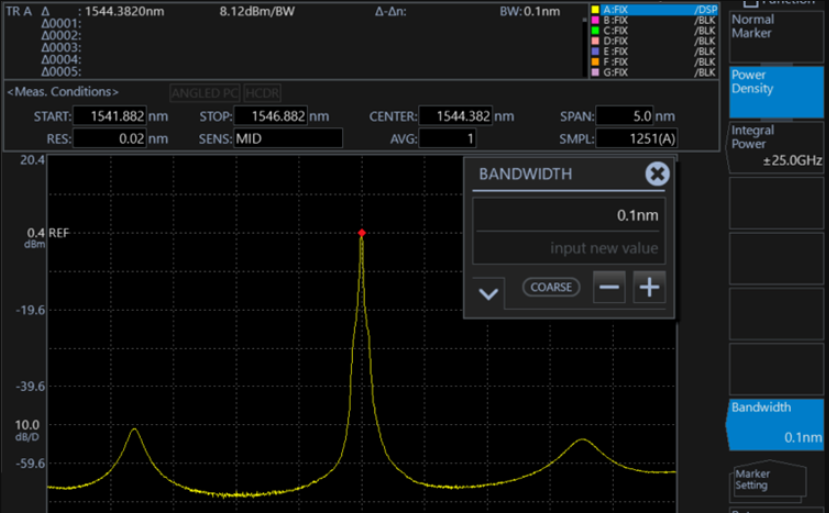
▲Normalized Bandwidth Setting Interface
According to the following diagram, you can see that the power spectral density marking function can also support the user to set multiple curve parameters at the same time, which is convenient to get the power relationship between multiple curves directly.
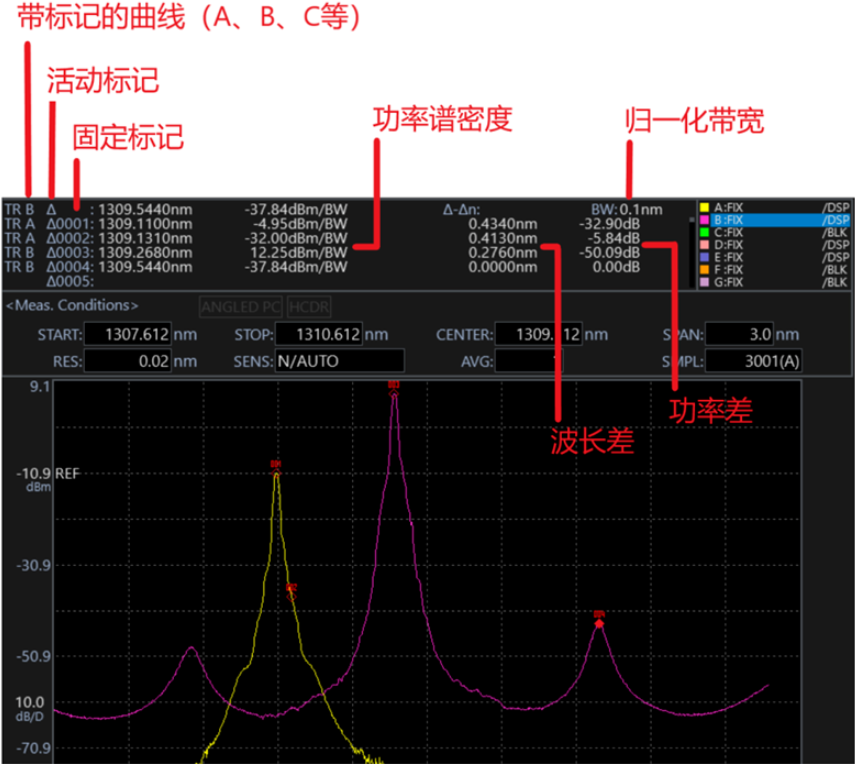
▲Schematic diagram of the spectrometer to set multiple power spectral density markers on multiple curves at the same time.
Integral Power Marker
Integral power marker is a function that displays the integrated power value of the specified frequency range into the data area centered on the marker position on the waveform. This function can be used to calculate the integrated power of the diffusion spectrum when the user modulates the spectrum of light to calculate the signal power.
As with conventional markers, the user can not only set a fixed marker on the integrated power marker, but also set the frequency range of integration between ±1.0 GHz ~ ±999.9 GHz for the moving marker and each fixed marker individually.
Operation Procedure
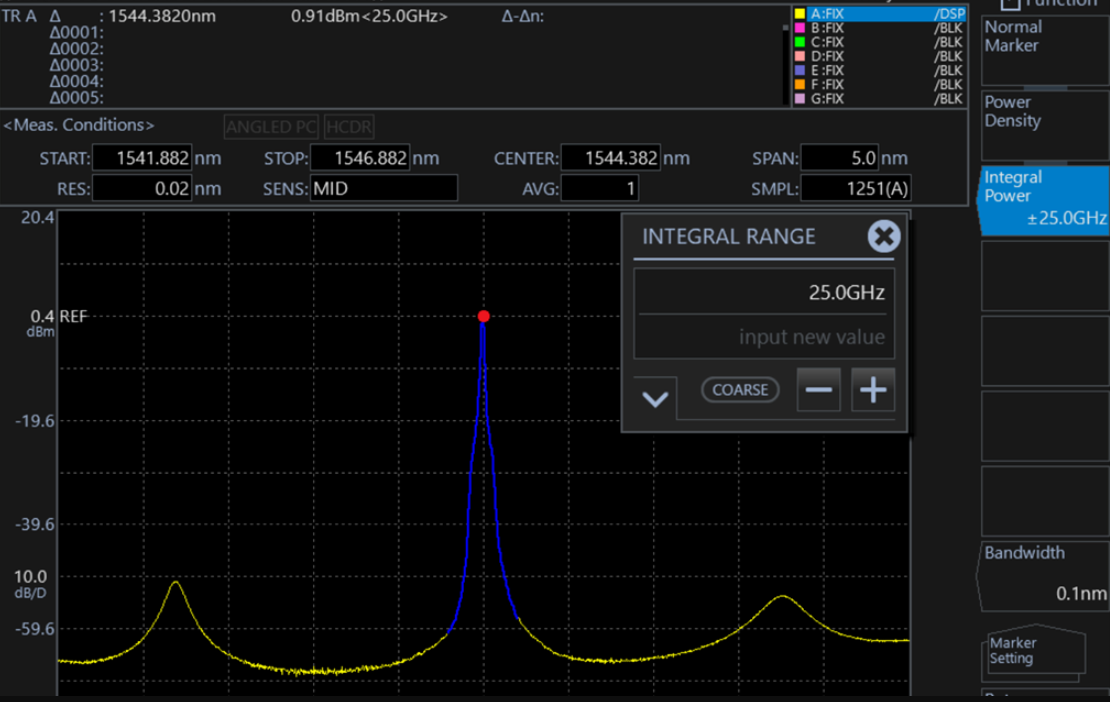
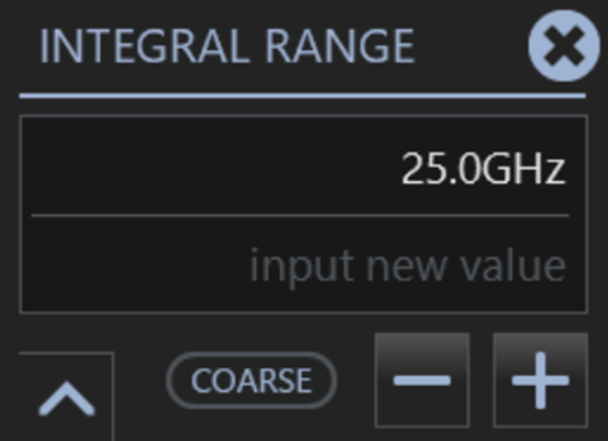
▲Integration range setting screen
① Click the MARKER button and set Maeker Active to ON;
② Click  and select
 the option;
③ Enter the integration range in the value input box, and the system will display the range as a blue highlighted part on the curve;
④ You can also change the center of integration by dragging the screen and entering the value in the “MOVE MARKER” window.
Like the power spectral density markers, the user can set fixed markers on different curves and get their integrated power at the same time.
Yokogawa AQ6370E series spectrometer of this spectrometer's traditional functions, in fact, also hides a particularly useful function - advanced marking function! Unprecedented way to analyze data and measurement signals, not only brings a new test experience, but also improve the speed of measurement, so how to find this function, today we take a look at it!
Advanced Marker Function
The Advanced Marker Function is a function that allows users to easily obtain the power density and integrated power of a given spectrum by adding specific markers. This innovative design not only allows users to get rid of signal modulation, but also directly from the spectrum to obtain the OSNR (optical signal/noise ratio) value of the hope of becoming a reality; at the same time, it is also the field of optical communications, fiber optic sensing and spectral analysis of the engineers to quickly and accurately assess the signal quality, optimize the performance of the system is a good helper. The following is an introduction to the most commonly used power spectral density markers and integral power markers among the advanced markers.
Power Spectral Density Marker
Power Spectral Density Marker is a function that displays each power value within the normalized bandwidth setting range of 0.1nm ~ 10.0nm into the data area centered on the marker position on the waveform. When measuring the noise power of a signal, the user can use these markers to calculate the power value corresponding to each set bandwidth.
The operation procedure is shown below:

▲Flowchart of Power Spectral Density Marker Function
① Click the MARKIET button and set markit Active to ON;
② Click ,  and select Power Density option;
① Click MARKIET button to set the markit Active to ON; ② Click and select Power Density option; ③ Set the normalized bandwidth through the pop-up BANDWIDTH input box, the interface is shown in the following figure.

▲Normalized Bandwidth Setting Interface
According to the following diagram, you can see that the power spectral density marking function can also support the user to set multiple curve parameters at the same time, which is convenient to get the power relationship between multiple curves directly.

▲Schematic diagram of the spectrometer to set multiple power spectral density markers on multiple curves at the same time.
Integral Power Marker
Integral power marker is a function that displays the integrated power value of the specified frequency range into the data area centered on the marker position on the waveform. This function can be used to calculate the integrated power of the diffusion spectrum when the user modulates the spectrum of light to calculate the signal power.
As with conventional markers, the user can not only set a fixed marker on the integrated power marker, but also set the frequency range of integration between ±1.0 GHz ~ ±999.9 GHz for the moving marker and each fixed marker individually.
Operation Procedure

▲Integration range setting screen
① Click the MARKER button and set Maeker Active to ON;
② Click  and select
 the option;
③ Enter the integration range in the value input box, and the system will display the range as a blue highlighted part on the curve;

④ You can also change the center of integration by dragging the screen and entering the value in the “MOVE MARKER” window.
Like the power spectral density markers, the user can set fixed markers on different curves and get their integrated power at the same time.


