


Introduction and application of oscilloscopes (knowledge sharing)


Learn the principle and function of oscilloscope (oscilloscope), and do simple use.
Oscilloscope principle
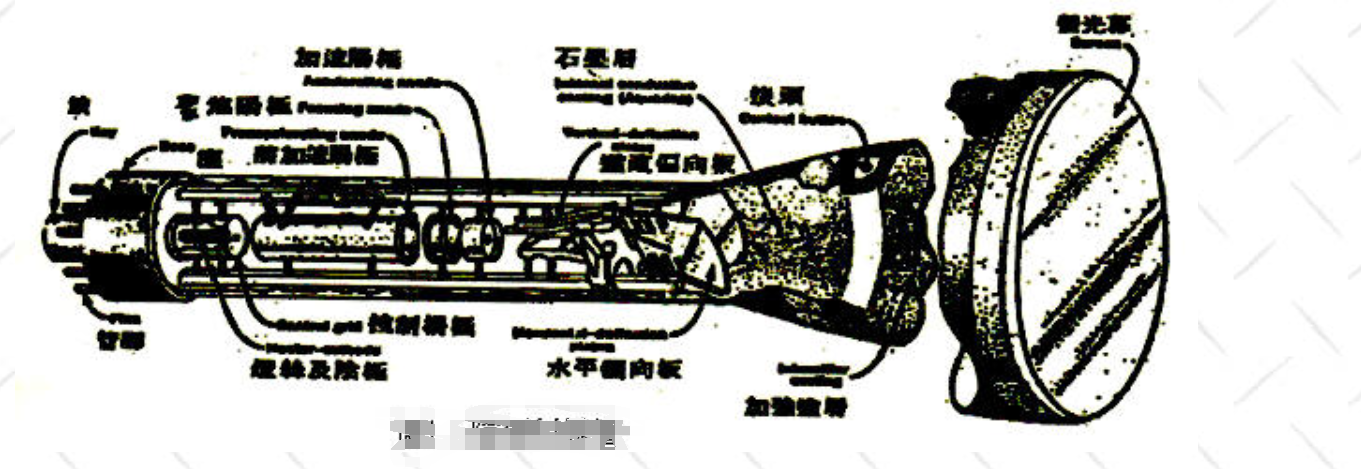
A diagram of a cathode ray tube closer to the actual design is shown in the figure. The cathode ray tube is the heart of the oscilloscope. The cathode is heated by the filament to produce hot wanderers. These electrons are attracted or suppressed by the control grid and then attracted by the accelerating anode, and pass through the focusing anode and accelerating anode, and then pass through the vertical and horizontal deflection plate, and then hit the fluorescent screen after being deflected. Electrons hit the fluorescent screen to release fluorescence and form a bright spot, and then return to the cathode through the tube wall coating and form a circuit.
The horizontal bias voltage is the sawtooth wave provided by the oscilloscope itself (Figure 2), and the vertical bias voltage is the external input voltage signal to be measured.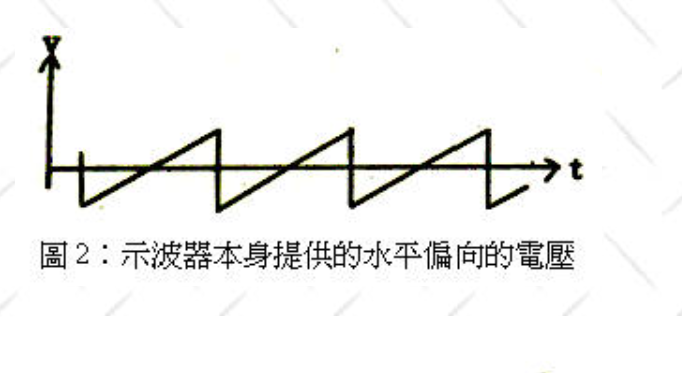
An example is shown in Figure 3.
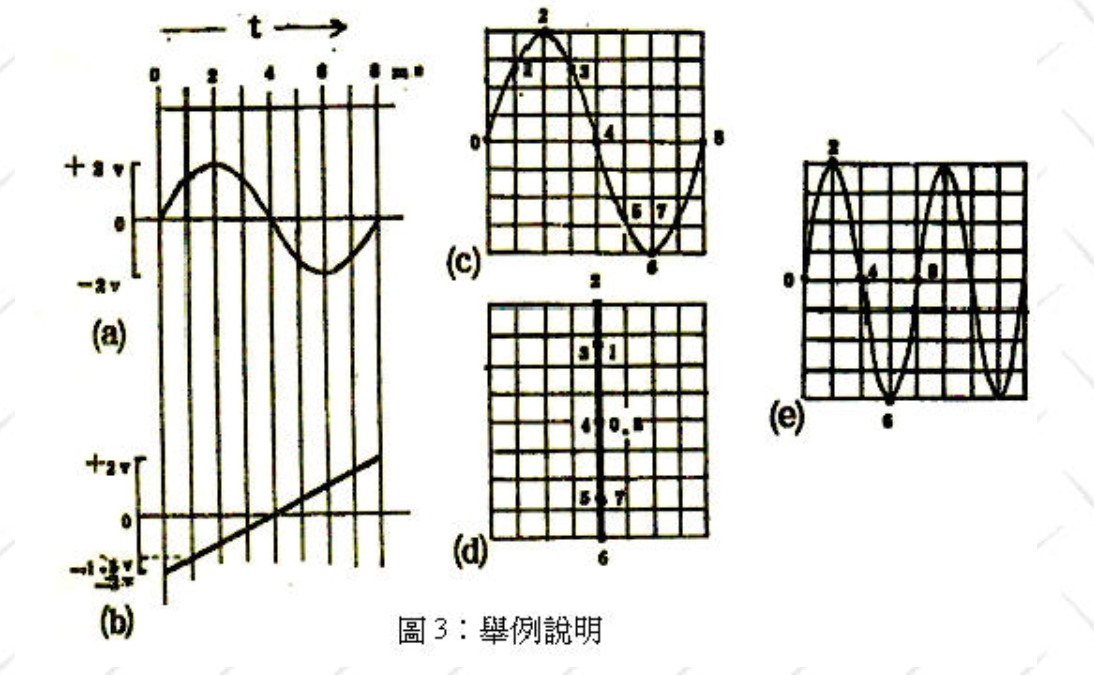
Figure 3(a) shows the input sinusoidal voltage waveform applied to the vertically biased board of the oscilloscope.
Figure 3(b) shows the sawtooth waveform provided by the oscilloscope itself and added to the horizontally biased board.
These two time-varying voltage waves are synthesized on the oscilloscope as the sinusoidal waveform in Figure 3(c).
If the horizontal bias voltage of the oscilloscope is canceled, the waveform as in Figure 3 (d) will be displayed on the fluorescent screen.
If we increase the period of the sawtooth waveform from the original 8ms (Fig. 3(b)) to 16ms while the vertical input maintains the same graph (Fig. 3(a)), the synthesized graph of both on the oscilloscope will be Fig. 3(e).
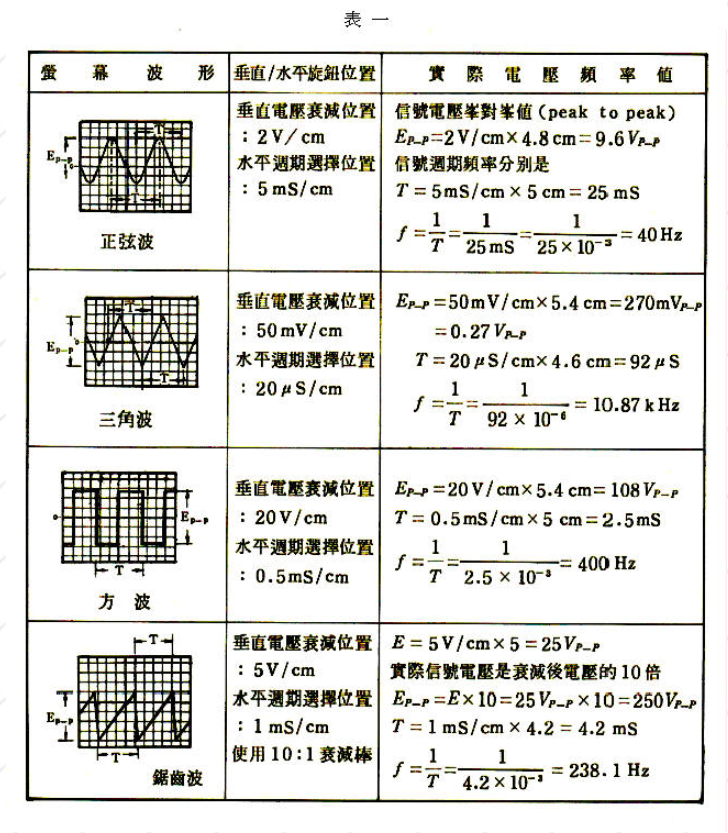
Let us now discuss in more detail how to convert the waveform displayed on the screen into the voltage and frequency of the real signal to be measured. This is described in Table I.
The following is a general description of the entire structure of the oscilloscope in a block diagram (Figure 4). We illustrate it in several subsystems:
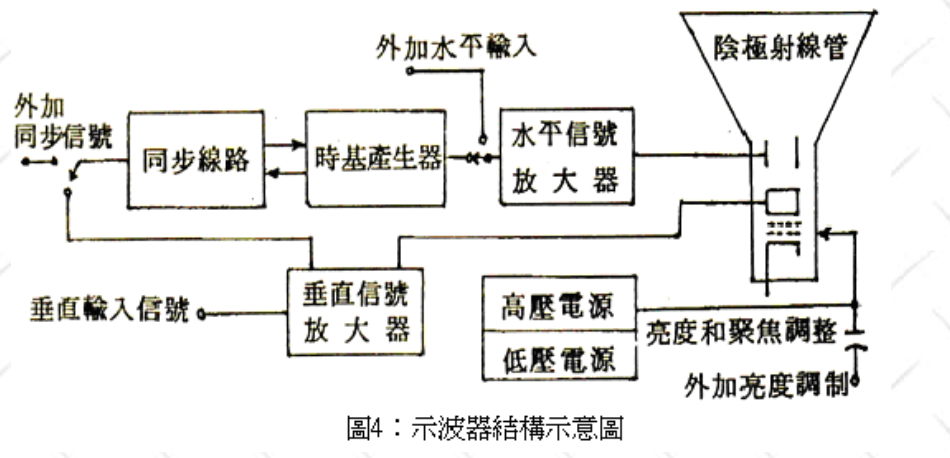
Cathode ray tube: As mentioned before, it includes filament, cathode, control grid, focusing and accelerating anode, horizontal and vertical bias plate, and fluorescent screen.
(i) Vertical signal system: The vertical signal system is composed of many stages of amplifiers. The amplifier faithfully amplifies or attenuates the input signal so that the oscilloscope can accept a wide range of input voltages.
(b) Horizontal signal system: The horizontal signal system consists of a time base generator, a synchronization line and a horizontal signal amplifier. Synchronous line from the vertical amplifier to take out the amplified input voltage signal, select a certain voltage point (such as zero, positive slope, etc.), and order the time base generator (to generate sawtooth wave) to start scanning 3/4 This role is to "trigger" 3/4 to make the horizontal bias voltage and vertical bias voltage in line with the pace.
(c) High-voltage and low-voltage power supply: The high-voltage source mainly provides the cathode tube acceleration voltage (DC high voltage), usually 1200 ~ 2000 volts DC. The low-voltage power supply supplies the power needed for the operation of other circuits in the oscilloscope. If the oscilloscope's horizontal bias voltage from external signal input instead of the oscilloscope internal generated sawtooth wave, the oscilloscope can be turned into an X-Y graphing machine.
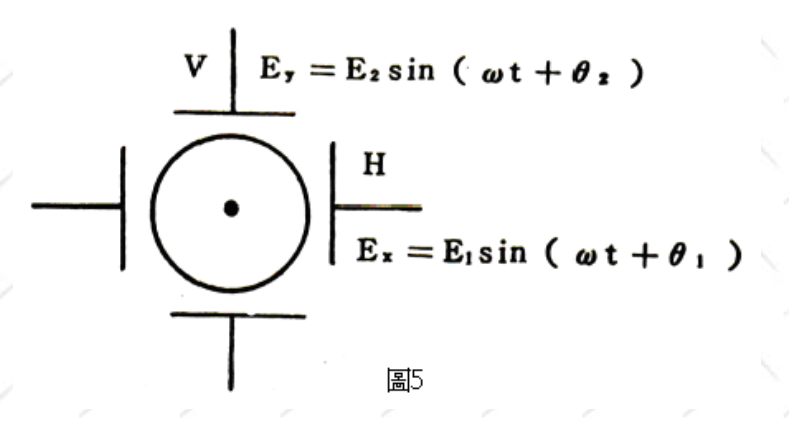
Then we will discuss the Lissajous pattern method (Lissajous pattern method) applied to the principle of measuring frequency. If we input sine wave voltage on the vertical and horizontal bias plate of the oscilloscope, the graph displayed by the oscilloscope, we call it Lissajous pattern.
Suppose we input two signals of equal frequency to the horizontal and vertical bias plates, then the screen may appear: a circle, an ellipse or an inclined straight line. As to which graph, it depends on the magnitude of the two input voltages and their phase (phase).
If no signal is added to both the vertical and horizontal bias plates, the dot on the screen will appear in a fixed position (as shown in Figure 5).
Learn the principle and function of oscilloscope (oscilloscope), and do simple use.
Oscilloscope principle
A diagram of a cathode ray tube closer to the actual design is shown in the figure. The cathode ray tube is the heart of the oscilloscope. The cathode is heated by the filament to produce hot wanderers. These electrons are attracted or suppressed by the control grid and then attracted by the accelerating anode, and pass through the focusing anode and accelerating anode, and then pass through the vertical and horizontal deflection plate, and then hit the fluorescent screen after being deflected. Electrons hit the fluorescent screen to release fluorescence and form a bright spot, and then return to the cathode through the tube wall coating and form a circuit.
The horizontal bias voltage is the sawtooth wave provided by the oscilloscope itself (Figure 2), and the vertical bias voltage is the external input voltage signal to be measured.
An example is shown in Figure 3.
Figure 3(a) shows the input sinusoidal voltage waveform applied to the vertically biased board of the oscilloscope.
Figure 3(b) shows the sawtooth waveform provided by the oscilloscope itself and added to the horizontally biased board.
These two time-varying voltage waves are synthesized on the oscilloscope as the sinusoidal waveform in Figure 3(c).
If the horizontal bias voltage of the oscilloscope is canceled, the waveform as in Figure 3 (d) will be displayed on the fluorescent screen.
If we increase the period of the sawtooth waveform from the original 8ms (Fig. 3(b)) to 16ms while the vertical input maintains the same graph (Fig. 3(a)), the synthesized graph of both on the oscilloscope will be Fig. 3(e).
Let us now discuss in more detail how to convert the waveform displayed on the screen into the voltage and frequency of the real signal to be measured. This is described in Table I.
The following is a general description of the entire structure of the oscilloscope in a block diagram (Figure 4). We illustrate it in several subsystems:
Cathode ray tube: As mentioned before, it includes filament, cathode, control grid, focusing and accelerating anode, horizontal and vertical bias plate, and fluorescent screen.
(i) Vertical signal system: The vertical signal system is composed of many stages of amplifiers. The amplifier faithfully amplifies or attenuates the input signal so that the oscilloscope can accept a wide range of input voltages.
(b) Horizontal signal system: The horizontal signal system consists of a time base generator, a synchronization line and a horizontal signal amplifier. Synchronous line from the vertical amplifier to take out the amplified input voltage signal, select a certain voltage point (such as zero, positive slope, etc.), and order the time base generator (to generate sawtooth wave) to start scanning 3/4 This role is to "trigger" 3/4 to make the horizontal bias voltage and vertical bias voltage in line with the pace.
(c) High-voltage and low-voltage power supply: The high-voltage source mainly provides the cathode tube acceleration voltage (DC high voltage), usually 1200 ~ 2000 volts DC. The low-voltage power supply supplies the power needed for the operation of other circuits in the oscilloscope. If the oscilloscope's horizontal bias voltage from external signal input instead of the oscilloscope internal generated sawtooth wave, the oscilloscope can be turned into an X-Y graphing machine.
Then we will discuss the Lissajous pattern method (Lissajous pattern method) applied to the principle of measuring frequency. If we input sine wave voltage on the vertical and horizontal bias plate of the oscilloscope, the graph displayed by the oscilloscope, we call it Lissajous pattern.
Suppose we input two signals of equal frequency to the horizontal and vertical bias plates, then the screen may appear: a circle, an ellipse or an inclined straight line. As to which graph, it depends on the magnitude of the two input voltages and their phase (phase).
If no signal is added to both the vertical and horizontal bias plates, the dot on the screen will appear in a fixed position (as shown in Figure 5).