


The most complete eye chart analysis is here (technical sharing)


How does the eye diagram form the principle?
In the oscilloscope to observe the transmitted data signal, using the timing signal of the system under test, through the oscilloscope external trigger or external synchronization to control the scan of the oscilloscope, because the scan period at this time is exactly an integer multiple of the period of the signal under test, so the observation on the oscilloscope fluorescent screen is a number of random symbol waveforms together to form a stable graph. This graph looks like an eye, called the eye diagram of the digital signal. A complete eye diagram should contain "000" to "111" of all the state groups, eight states to form the eye diagram process is shown in the following figure.
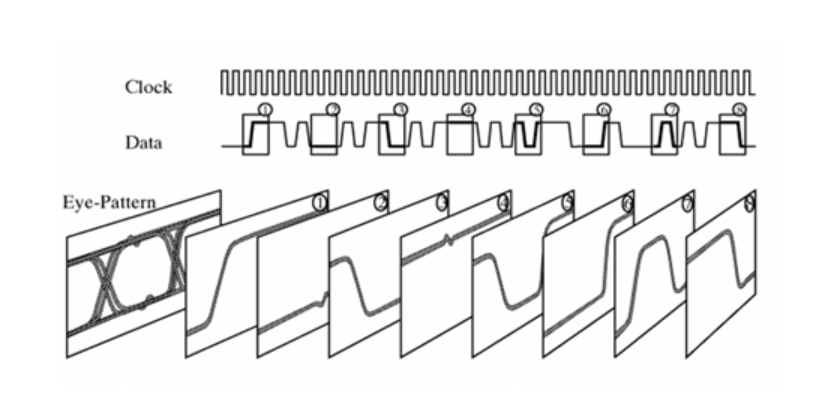
The oscilloscope generally measures the signal is some bits or a certain period of time waveform, more reflect the details of information, while the eye diagram is a series of digital signals accumulated on the oscilloscope and displayed graphics, it contains a wealth of information, from the eye diagram can be observed between the code crosstalk and the impact of noise, reflecting the overall characteristics of the digital signal, so as to estimate the degree of system strengths and weaknesses, to provide a basis for the improvement of the overall system performance.
Structure and parameters of the eye diagram
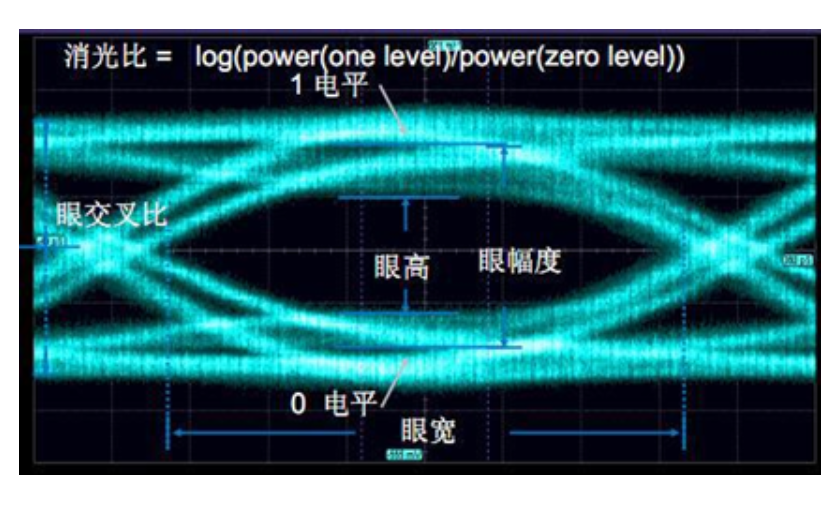
There are many parameters of the eye diagram, such as eye height, eye width, eye amplitude, eye cross ratio, extinction ratio, Q-factor, average power, etc. Each parameter is shown in the following figure.
The "eye amplitude" represents the difference between the average of the "1" level signal distribution and the "0" level signal distribution, and is measured by distributing the amplitude in the area near the center of the eye diagram (usually 20% of the distance between the zero crossing It is measured by distributing the amplitude values in the area near the center of the eye diagram (usually 20% of the distance between zero crossing times).
The "eye width" reflects the total jitter of the signal, i.e. the size of the eye diagram opening in the horizontal axis, defined as the time difference between the points where the two upper and lower edges meet (Crossing Point).
The "eye height" is the size of the eye diagram opened in the vertical axis, which is a signal-to-noise ratio measurement very similar to the eye diagram amplitude.
Some complex concepts such as extinction ratio are introduced in detail below to help understand the performance of the eye diagram.
Extinction Ratio
The extinction ratio is defined as the value of "1" level over " 0" level in the eye diagram. The extinction ratio requirement varies depending on the rate, transmission distance and laser type. In general, for FP/DFB direct tuning laser requires an extinction ratio of not less than 8.2dB. EML electroabsorption laser extinction ratio of not less than 10dB. ITU-T does not specify a maximum value for the extinction ratio, but this does not mean that the extinction ratio can be infinitely large, the extinction ratio is too high, which will lead to too large chirp factor of the laser, resulting in excessive channel cost, which is not conducive to long-distance transmission. It is generally recommended that the actual extinction ratio is 0.5~1.5dB larger than the minimum required extinction ratio. this is not an absolute value, the reason why such a value is given is afraid that the extinction ratio is too high, the signal degradation after transmission is too strong, resulting in false code generation or channel cost overrun.
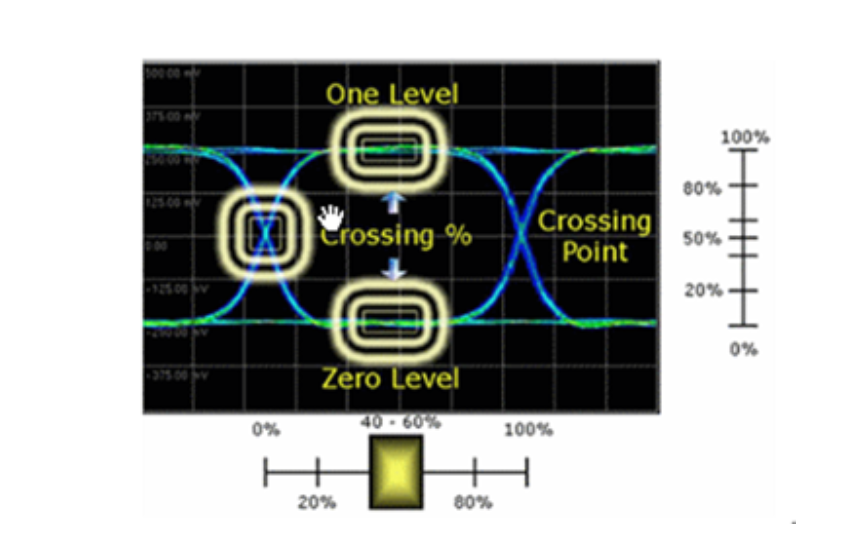
Eye cross-ratio
The crossover point is where the two eyes cross, and its ratio reflects the size of the duty cycle of the signal. As the transmission process, the pulse width of the optical signal will widen, causing the crossover point on the receiving side to move up relative to the transmitting side. In order to facilitate long-distance transmission, to ensure that the proportion of the cross-point on the receiving side is about 50%, so that the sensitivity of the receiving side is the best, we generally recommend that the location of the cross-point on the transmitting side is slightly shifted down, and the proportion of the cross-point on the transmitting side is generally recommended to be controlled at 40% to 45%.
Q-factor
The Q-factor can be measured with an oscilloscope and reflects the quality of the eye diagram, the higher the Q-factor, the better the quality of the eye diagram. In general, the thinner and smoother the line at the "1" level in the eye diagram, the higher the Q factor. In the case of no optical attenuation, the Q-factor of the transmitting side light eye diagram should not be less than 12, the higher the better. The Q factor of the receiving measurement should not be less than 6, the higher the better.
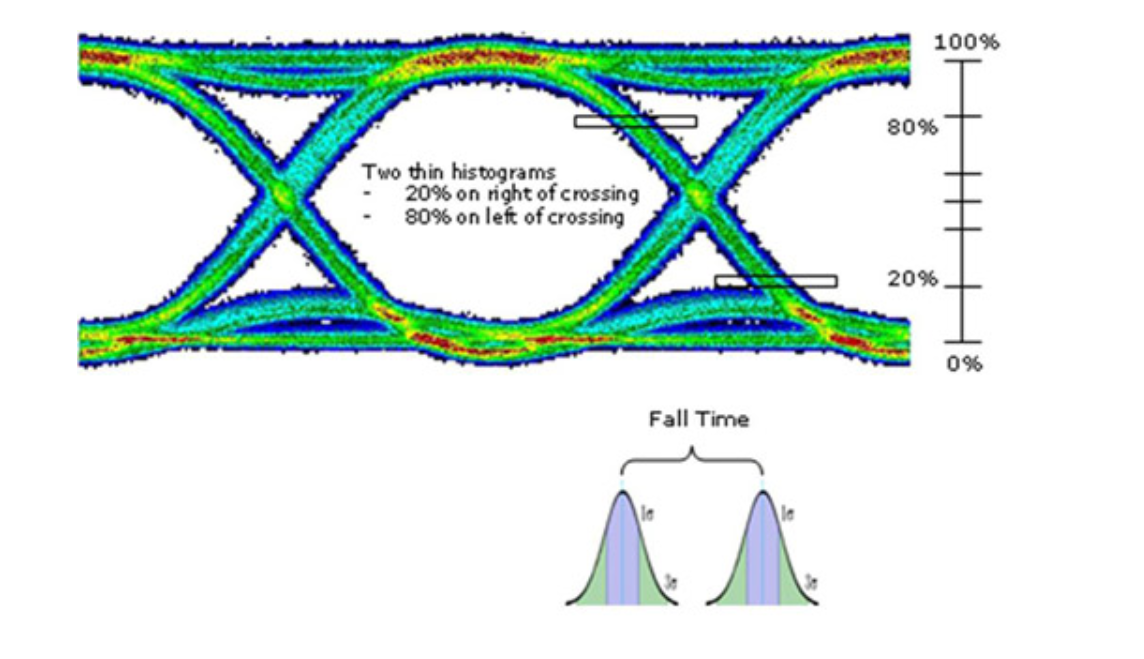
Rise time and fall time of the signal
The rise time and fall time of the signal reflect the rise and fall speed of the signal, and generally refer to the time of 20%~80% change of the whole signal amplitude. The rise and fall time is generally required to be no greater than 40% of the signal period. For example, 9.95G signal requires its rise and fall time to be no more than 40ps.
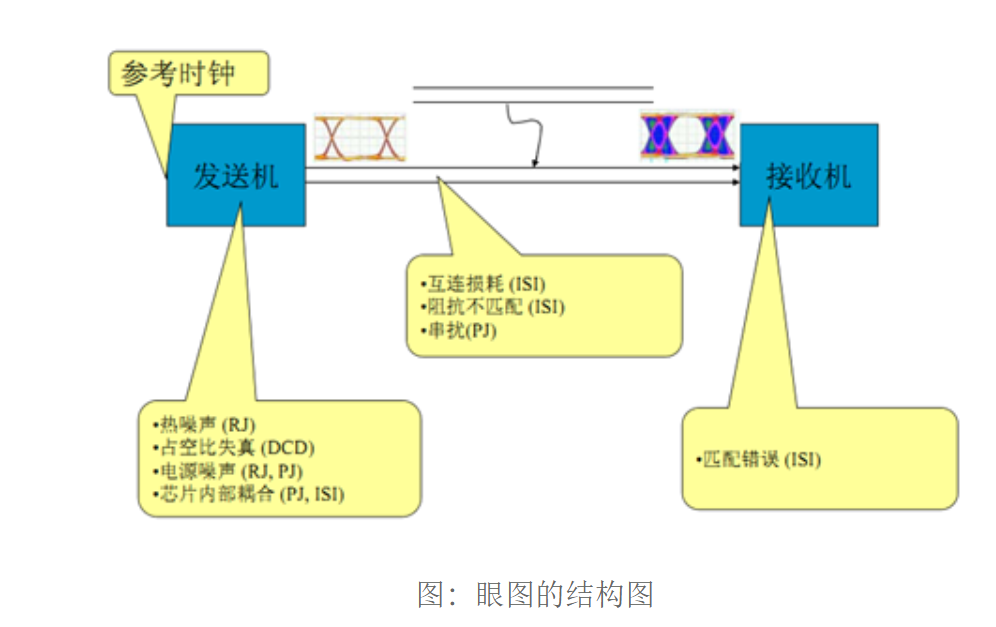
Jitter
Jitter is the timing noise that causes bit errors in high-speed data transmission lines. If the data rate of the system is increased, the amplitude of jitter measured within a few seconds will remain approximately the same, but when measured within a fraction of a bit period, it increases proportionally with the data rate, which in turn leads to BER. Therefore, it is important to reduce this associated jitter as much as possible in the system to improve the overall system performance. Analyzing jitter and its specific causes will help minimize the impact of jitter generation during system design, while the impact of jitter on BER can be determined and ensure that the system BER is below some maximum value, usually. Thus, the causes of jitter formation are visually represented in the following figure.
Signal-to-noise ratio
The signal-to-noise ratio also qualitatively reflects the quality of the signal and serves as a reference for comparison. Quantitative measurements require the use of a spectrum analyzer.
Eye diagram and system performance
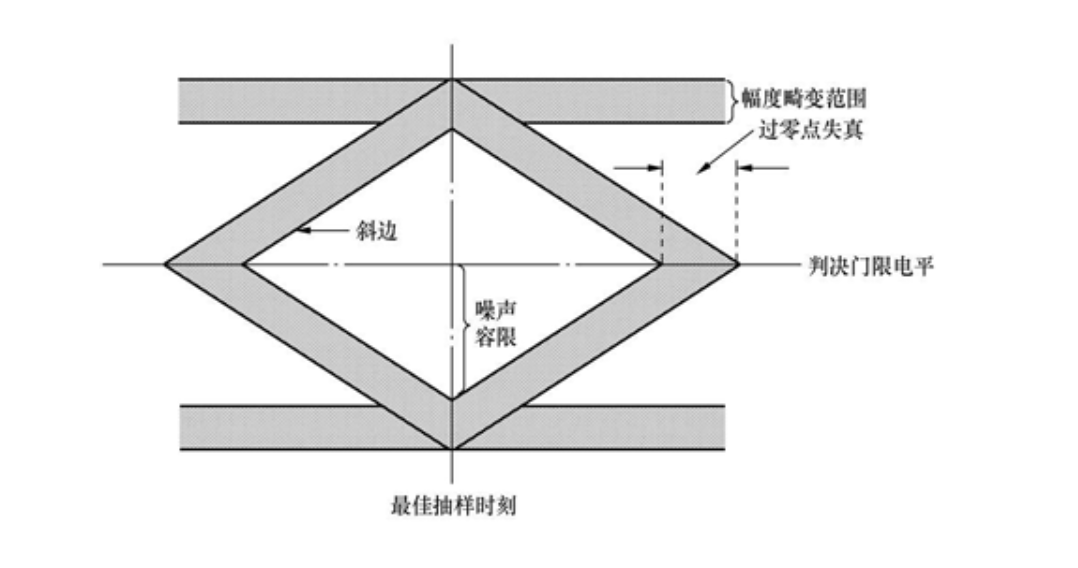
The overall system performance can be derived from the eye diagram after research and experimentation, and the following conclusions are given here in conjunction with the eye diagram framework.
(1) The optimal sampling time should be the time when the "eye" is most open.
(2) The slope of the sloping edge of the eye diagram determines the sensitivity of the system to sampling timing errors; the larger the slope, the more sensitive it is to timing errors.
(3) The vertical height of the shaded area of the eye diagram indicates the distortion range of the signal.
(4) The position of the horizontal axis in the center of the eye diagram corresponds to the judgment threshold level.
(5) The over-zero distortion is the length of the shadow pressed on the horizontal axis, and the timing standard of some receivers is determined by the average position of the passing judgment threshold, so the larger the over-zero distortion is, the more unfavorable to the extraction of the timing standard.
(6) Half of the distance between the upper and lower shaded areas at the sampling moment is the noise tolerance, the noise transient value exceeds it may occur wrong judgment.
Eye diagram and BER
In a digital circuit system, the sender sends out multiple bits of data, and the receiver may receive some incorrect bits (i.e., BER) due to a variety of factors. The ratio of the number of erroneous bits to the total number of bits is called the Bit Error Ratio, or BER, which is the most important parameter for describing the performance of a digital circuit system. In GHz bit rate communication circuit systems (e.g. Fibre Channel, PCIe, SONET, SATA), BER is usually required to be less than or equal to 10-12. When the BER is large, the communication system has low efficiency and unstable performance. Factors that affect BER include jitter, noise, loss of the channel, bit rate of the signal, etc.
In a bit-error-rate (BER) test, the code generator generates billions of data bits and sends them to the input device, which then receives them at the output. The BER analyzer then compares the received data with the original data sent bit by bit to determine which codes were received incorrectly, and subsequently gives the calculated BER over a period of time. considering the need for BER testing, we use the following actual test eye diagram as a reference to generate a BER diagram, the reference eye diagram is shown below.
The BER plot is a function of the sample point time position BER(t) and is called a BERT sweep plot or bathtub curve. In short, it is the BER measured at different times t relative to the rated sampling time given by the reference clock. the reference clock can be the signal transmitter clock or a clock recovered from the received signal, depending on the system under test. Using the eye diagram above as a reference, the relationship between eye opening and BER and its BER plot is as follows.
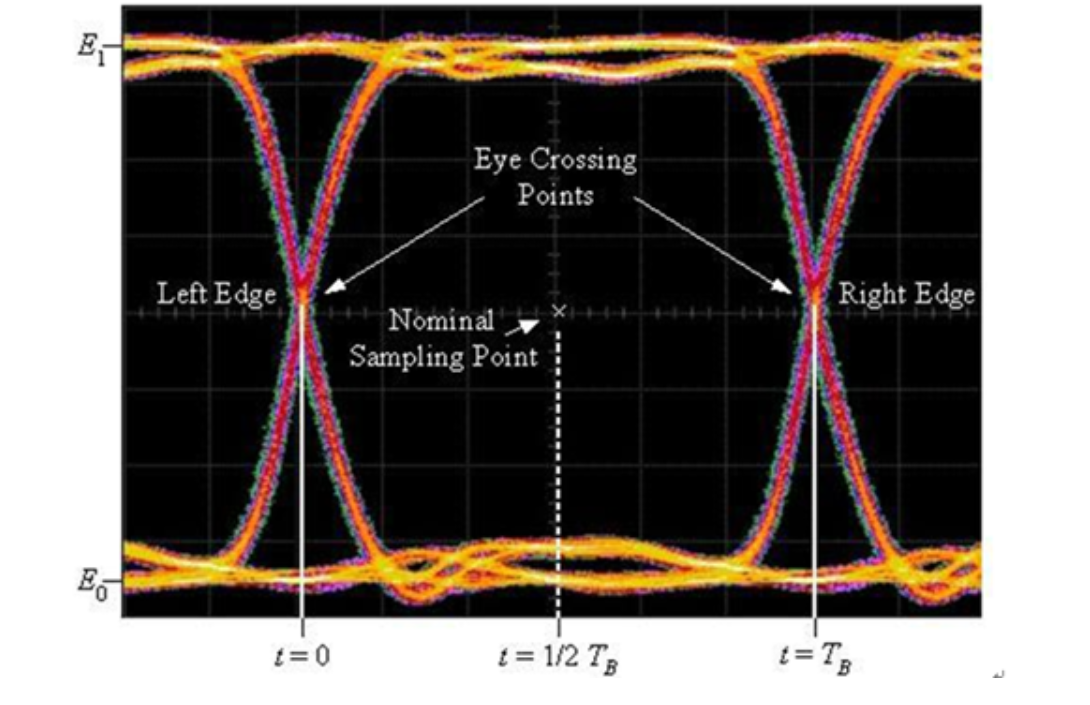
图 眼睛张开度与误码率的关系
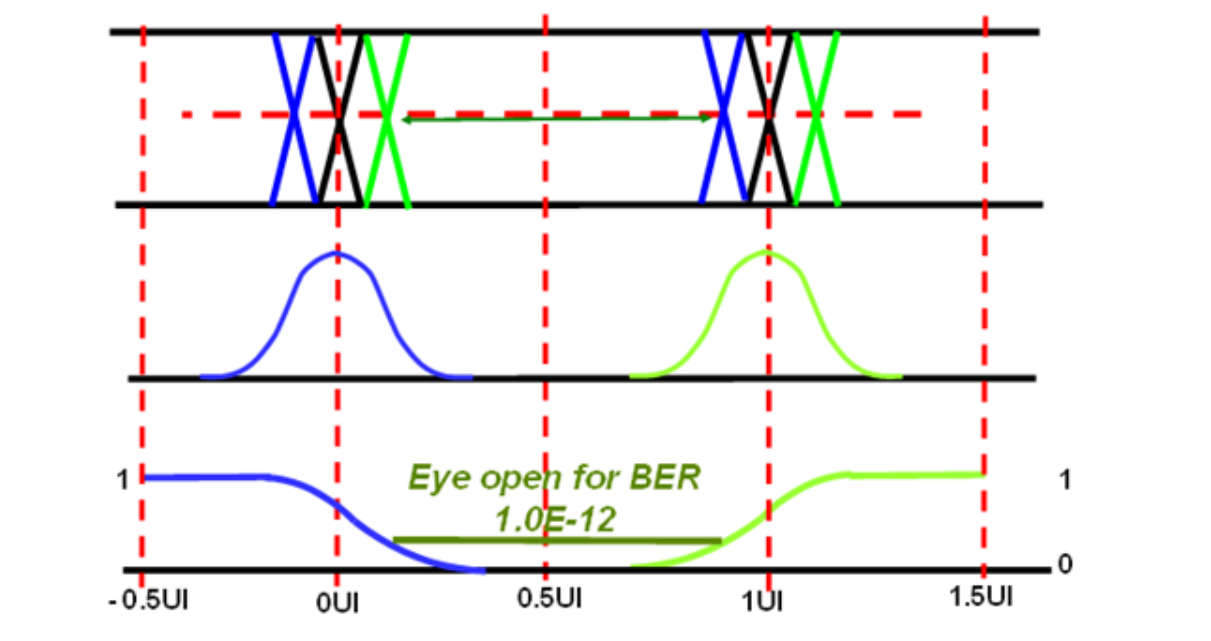
图 BER(T)扫描或浴缸曲线
In the above two plots, the BER plot is the same as the eye diagram time axis, with the sides corresponding to the edges of the eye diagram and the sample point at the center. the distance between the curves at a certain BER is the degree of eye diagram opening at that BER. Dithering causes the BER to increase to a maximum of 0.5 as the sample points approach the intersection point.
How does the eye diagram form the principle?
In the oscilloscope to observe the transmitted data signal, using the timing signal of the system under test, through the oscilloscope external trigger or external synchronization to control the scan of the oscilloscope, because the scan period at this time is exactly an integer multiple of the period of the signal under test, so the observation on the oscilloscope fluorescent screen is a number of random symbol waveforms together to form a stable graph. This graph looks like an eye, called the eye diagram of the digital signal. A complete eye diagram should contain "000" to "111" of all the state groups, eight states to form the eye diagram process is shown in the following figure.
The oscilloscope generally measures the signal is some bits or a certain period of time waveform, more reflect the details of information, while the eye diagram is a series of digital signals accumulated on the oscilloscope and displayed graphics, it contains a wealth of information, from the eye diagram can be observed between the code crosstalk and the impact of noise, reflecting the overall characteristics of the digital signal, so as to estimate the degree of system strengths and weaknesses, to provide a basis for the improvement of the overall system performance.
Structure and parameters of the eye diagram
There are many parameters of the eye diagram, such as eye height, eye width, eye amplitude, eye cross ratio, extinction ratio, Q-factor, average power, etc. Each parameter is shown in the following figure.
The "eye amplitude" represents the difference between the average of the "1" level signal distribution and the "0" level signal distribution, and is measured by distributing the amplitude in the area near the center of the eye diagram (usually 20% of the distance between the zero crossing It is measured by distributing the amplitude values in the area near the center of the eye diagram (usually 20% of the distance between zero crossing times).
The "eye width" reflects the total jitter of the signal, i.e. the size of the eye diagram opening in the horizontal axis, defined as the time difference between the points where the two upper and lower edges meet (Crossing Point).
The "eye height" is the size of the eye diagram opened in the vertical axis, which is a signal-to-noise ratio measurement very similar to the eye diagram amplitude.
Some complex concepts such as extinction ratio are introduced in detail below to help understand the performance of the eye diagram.
Extinction Ratio
The extinction ratio is defined as the value of "1" level over " 0" level in the eye diagram. The extinction ratio requirement varies depending on the rate, transmission distance and laser type. In general, for FP/DFB direct tuning laser requires an extinction ratio of not less than 8.2dB. EML electroabsorption laser extinction ratio of not less than 10dB. ITU-T does not specify a maximum value for the extinction ratio, but this does not mean that the extinction ratio can be infinitely large, the extinction ratio is too high, which will lead to too large chirp factor of the laser, resulting in excessive channel cost, which is not conducive to long-distance transmission. It is generally recommended that the actual extinction ratio is 0.5~1.5dB larger than the minimum required extinction ratio. this is not an absolute value, the reason why such a value is given is afraid that the extinction ratio is too high, the signal degradation after transmission is too strong, resulting in false code generation or channel cost overrun.
Eye cross-ratio
The crossover point is where the two eyes cross, and its ratio reflects the size of the duty cycle of the signal. As the transmission process, the pulse width of the optical signal will widen, causing the crossover point on the receiving side to move up relative to the transmitting side. In order to facilitate long-distance transmission, to ensure that the proportion of the cross-point on the receiving side is about 50%, so that the sensitivity of the receiving side is the best, we generally recommend that the location of the cross-point on the transmitting side is slightly shifted down, and the proportion of the cross-point on the transmitting side is generally recommended to be controlled at 40% to 45%.
Q-factor
The Q-factor can be measured with an oscilloscope and reflects the quality of the eye diagram, the higher the Q-factor, the better the quality of the eye diagram. In general, the thinner and smoother the line at the "1" level in the eye diagram, the higher the Q factor. In the case of no optical attenuation, the Q-factor of the transmitting side light eye diagram should not be less than 12, the higher the better. The Q factor of the receiving measurement should not be less than 6, the higher the better.
Rise time and fall time of the signal
The rise time and fall time of the signal reflect the rise and fall speed of the signal, and generally refer to the time of 20%~80% change of the whole signal amplitude. The rise and fall time is generally required to be no greater than 40% of the signal period. For example, 9.95G signal requires its rise and fall time to be no more than 40ps.
Jitter
Jitter is the timing noise that causes bit errors in high-speed data transmission lines. If the data rate of the system is increased, the amplitude of jitter measured within a few seconds will remain approximately the same, but when measured within a fraction of a bit period, it increases proportionally with the data rate, which in turn leads to BER. Therefore, it is important to reduce this associated jitter as much as possible in the system to improve the overall system performance. Analyzing jitter and its specific causes will help minimize the impact of jitter generation during system design, while the impact of jitter on BER can be determined and ensure that the system BER is below some maximum value, usually. Thus, the causes of jitter formation are visually represented in the following figure.
Signal-to-noise ratio
The signal-to-noise ratio also qualitatively reflects the quality of the signal and serves as a reference for comparison. Quantitative measurements require the use of a spectrum analyzer.
Eye diagram and system performance
The overall system performance can be derived from the eye diagram after research and experimentation, and the following conclusions are given here in conjunction with the eye diagram framework.
(1) The optimal sampling time should be the time when the "eye" is most open.
(2) The slope of the sloping edge of the eye diagram determines the sensitivity of the system to sampling timing errors; the larger the slope, the more sensitive it is to timing errors.
(3) The vertical height of the shaded area of the eye diagram indicates the distortion range of the signal.
(4) The position of the horizontal axis in the center of the eye diagram corresponds to the judgment threshold level.
(5) The over-zero distortion is the length of the shadow pressed on the horizontal axis, and the timing standard of some receivers is determined by the average position of the passing judgment threshold, so the larger the over-zero distortion is, the more unfavorable to the extraction of the timing standard.
(6) Half of the distance between the upper and lower shaded areas at the sampling moment is the noise tolerance, the noise transient value exceeds it may occur wrong judgment.
Eye diagram and BER
In a digital circuit system, the sender sends out multiple bits of data, and the receiver may receive some incorrect bits (i.e., BER) due to a variety of factors. The ratio of the number of erroneous bits to the total number of bits is called the Bit Error Ratio, or BER, which is the most important parameter for describing the performance of a digital circuit system. In GHz bit rate communication circuit systems (e.g. Fibre Channel, PCIe, SONET, SATA), BER is usually required to be less than or equal to 10-12. When the BER is large, the communication system has low efficiency and unstable performance. Factors that affect BER include jitter, noise, loss of the channel, bit rate of the signal, etc.
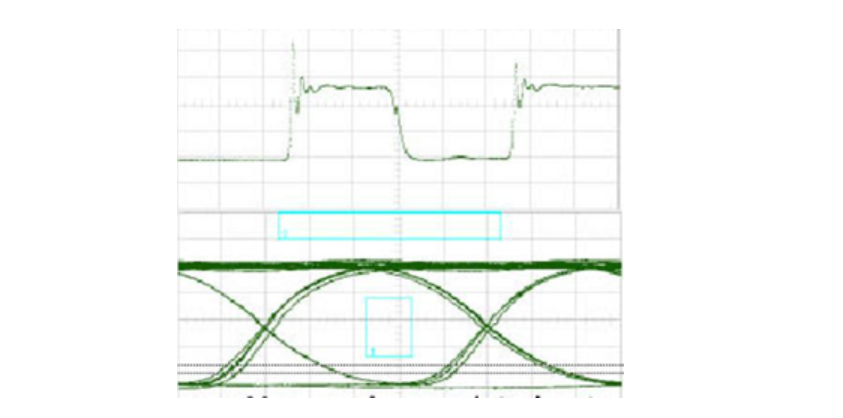
In a bit-error-rate (BER) test, the code generator generates billions of data bits and sends them to the input device, which then receives them at the output. The BER analyzer then compares the received data with the original data sent bit by bit to determine which codes were received incorrectly, and subsequently gives the calculated BER over a period of time. considering the need for BER testing, we use the following actual test eye diagram as a reference to generate a BER diagram, the reference eye diagram is shown below.
The BER plot is a function of the sample point time position BER(t) and is called a BERT sweep plot or bathtub curve. In short, it is the BER measured at different times t relative to the rated sampling time given by the reference clock. the reference clock can be the signal transmitter clock or a clock recovered from the received signal, depending on the system under test. Using the eye diagram above as a reference, the relationship between eye opening and BER and its BER plot is as follows.
图 眼睛张开度与误码率的关系
图 BER(T)扫描或浴缸曲线
In the above two plots, the BER plot is the same as the eye diagram time axis, with the sides corresponding to the edges of the eye diagram and the sample point at the center. the distance between the curves at a certain BER is the degree of eye diagram opening at that BER. Dithering causes the BER to increase to a maximum of 0.5 as the sample points approach the intersection point.