


The basic concept of eye diagram and how to test eye diagram with oscilloscope without eye diagram function


Nowadays, the oscilloscope is becoming more and more powerful, the oscilloscope is not just a simple look at the waveform, recently there are many customers want to use the oscilloscope to measure the eye diagram, but the budget is limited, there is no high-end oscilloscope on hand (such as DPO7354C, etc.), so how to measure the eye diagram?
The first thing to understand, what is the eye diagram.
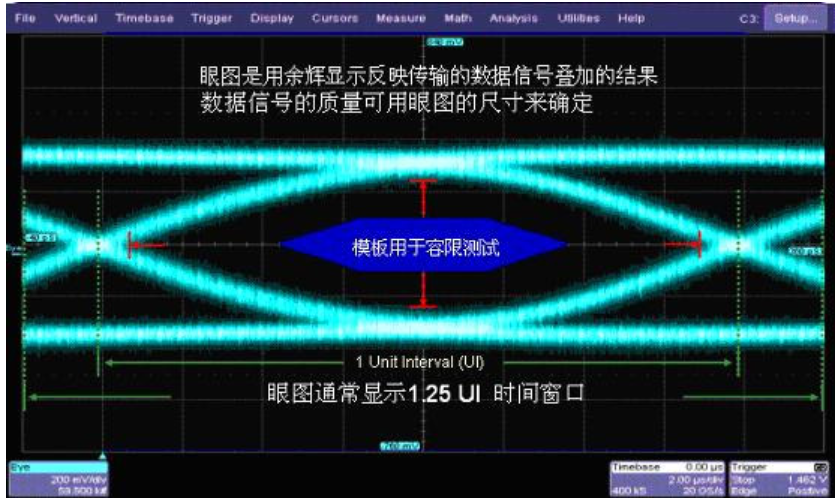
"An eye diagram is a graph that is shaped like an eye." An eye diagram is the result of cumulative overlay displaying bits of the acquired serial signal in afterglow, and the shape of the overlayed graph looks like an eye, hence the name eye diagram. The eye diagram usually shows a time window of 1.25 UI. There are various shapes of eyes and various shapes of eye diagrams. The quality of the signal can be quickly determined by the shape characteristics of the eye diagram.
Since the eye diagram is a graphical representation of the bit information of a serial signal, it has become the most important tool for measuring signal quality, and eye diagram measurements are sometimes called "Signal Quality Test (SQ Test)". In addition, the result of the eye diagram measurement is a pass or fail, its judgment is usually based on the relative "template (Mask)". The template specifies the tolerance of the serial signal "1" level, the tolerance of the "0" level, and the tolerance of the rise time and fall time. Therefore, eye diagram measurement is sometimes called "Mask Test".
There are various shapes of templates, and the usual templates for NRZ signals are shown in Figure 5 and Figure 8 in blue. The template of the eye diagram is different at different nodes of the serial data transmission, so it is important to pay attention to the specific sub-template type when selecting the template. If the template on the transmitter side is used as the eye diagram template on the receiver side, it may touch the template all the time. However, signals like Ethernet signals and E1/T1 signals, which are not NRZ code shapes, have a more specific template. When a bit touches the template, we think the signal quality is bad and need to debug the circuit. Some products require 100% not to touch the template, and some products allow the number of times to touch the template within a certain probability.
In the ideal case of no inter-code crosstalk and noise, the waveform will be distortion-free, each code element will overlap together, and the final trace seen on the oscilloscope is a thin and clear "eye", the "eye" is opened to the maximum. When there is inter-code crosstalk, the waveform is distorted, the code elements do not completely overlap, and the traces of the eye diagram will not be clear, causing the "eye" to be partially closed. If the noise is added, the lines of the eye diagram become blurred and the "eye" opens to a smaller size, so the size of the "eye" opening indicates the degree of distortion and reflects the strength of inter-coding crosstalk. Thus, it can be seen that the eye diagram can visually show the impact of inter-code crosstalk and noise, and can evaluate the performance of a baseband transmission system. In addition, the graph can also be used to adjust the characteristics of the receive filter to reduce inter-crosstalk and improve the transmission performance of the system.
There are three ways to test the eye diagram with an oscilloscope, according to the test effect and the requirements of the oscilloscope to be divided, as follows.
1, oscilloscope with eye diagram measurement function.
In this case, directly open the function, the instrument automatically test, automatically restore the clock and test the openness, jitter and other parameters, the best results, and is a quantitative test.
2, the oscilloscope without eye diagram measurement function, the test signal including data lines and clock lines.
This time you can use the clock signal as the trigger signal to test the eye diagram of the data signal. This method is also very good, can be more accurate to see the eye diagram shape, small error, simple operation.
3, the oscilloscope without eye diagram measurement function, the signal only a data line.
This time is not to do eye diagram test, if you must test can only qualitative test, the method is: use the oscilloscope rising edge trigger signal, and the trigger point to migrate until it can not move, trigger the oscilloscope, open the waveform hold, you can roughly look at the signal eye diagram, but the results will prefer, at least jitter will be small.
If you do not have a high-end oscilloscope at hand, but need to observe the eye diagram on the oscilloscope to understand the general situation of the signal and make simple measurements, then use the Tektronix DPO2000B, MSO2000B, MDO3000, DPO4000B, MSO4000B, MDO4000B series and other economic oscilloscopes on the eye diagram measurement can be achieved through simple settings. Specific settings are as follows.
1, the signal observed when triggered with the edge.
2, select the trigger mode for ascending / descending time, the slope to ascending or descending.
3, the trigger threshold high and low levels are adjusted to a suitable position, preferably with low values around 10%-20% and high values around 80%-90%, to indicate the threshold range of the rise and fall time trigger.
4, according to the measured signal (estimated out) the approximate size of the rise and fall time, select the trigger time less than the time.
5, set up after seeing the waveform as shown in the figure, there is no cumulative effect at this time.
6, open the function of afterglow, and turn up the brightness of the waveform, you can observe whether there are abnormal signals occurring.
Nowadays, the oscilloscope is becoming more and more powerful, the oscilloscope is not just a simple look at the waveform, recently there are many customers want to use the oscilloscope to measure the eye diagram, but the budget is limited, there is no high-end oscilloscope on hand (such as DPO7354C, etc.), so how to measure the eye diagram?
The first thing to understand, what is the eye diagram.
"An eye diagram is a graph that is shaped like an eye." An eye diagram is the result of cumulative overlay displaying bits of the acquired serial signal in afterglow, and the shape of the overlayed graph looks like an eye, hence the name eye diagram. The eye diagram usually shows a time window of 1.25 UI. There are various shapes of eyes and various shapes of eye diagrams. The quality of the signal can be quickly determined by the shape characteristics of the eye diagram.
Since the eye diagram is a graphical representation of the bit information of a serial signal, it has become the most important tool for measuring signal quality, and eye diagram measurements are sometimes called "Signal Quality Test (SQ Test)". In addition, the result of the eye diagram measurement is a pass or fail, its judgment is usually based on the relative "template (Mask)". The template specifies the tolerance of the serial signal "1" level, the tolerance of the "0" level, and the tolerance of the rise time and fall time. Therefore, eye diagram measurement is sometimes called "Mask Test".
There are various shapes of templates, and the usual templates for NRZ signals are shown in Figure 5 and Figure 8 in blue. The template of the eye diagram is different at different nodes of the serial data transmission, so it is important to pay attention to the specific sub-template type when selecting the template. If the template on the transmitter side is used as the eye diagram template on the receiver side, it may touch the template all the time. However, signals like Ethernet signals and E1/T1 signals, which are not NRZ code shapes, have a more specific template. When a bit touches the template, we think the signal quality is bad and need to debug the circuit. Some products require 100% not to touch the template, and some products allow the number of times to touch the template within a certain probability.
In the ideal case of no inter-code crosstalk and noise, the waveform will be distortion-free, each code element will overlap together, and the final trace seen on the oscilloscope is a thin and clear "eye", the "eye" is opened to the maximum. When there is inter-code crosstalk, the waveform is distorted, the code elements do not completely overlap, and the traces of the eye diagram will not be clear, causing the "eye" to be partially closed. If the noise is added, the lines of the eye diagram become blurred and the "eye" opens to a smaller size, so the size of the "eye" opening indicates the degree of distortion and reflects the strength of inter-coding crosstalk. Thus, it can be seen that the eye diagram can visually show the impact of inter-code crosstalk and noise, and can evaluate the performance of a baseband transmission system. In addition, the graph can also be used to adjust the characteristics of the receive filter to reduce inter-crosstalk and improve the transmission performance of the system.
There are three ways to test the eye diagram with an oscilloscope, according to the test effect and the requirements of the oscilloscope to be divided, as follows.
1, oscilloscope with eye diagram measurement function.
In this case, directly open the function, the instrument automatically test, automatically restore the clock and test the openness, jitter and other parameters, the best results, and is a quantitative test.
2, the oscilloscope without eye diagram measurement function, the test signal including data lines and clock lines.
This time you can use the clock signal as the trigger signal to test the eye diagram of the data signal. This method is also very good, can be more accurate to see the eye diagram shape, small error, simple operation.
3, the oscilloscope without eye diagram measurement function, the signal only a data line.
This time is not to do eye diagram test, if you must test can only qualitative test, the method is: use the oscilloscope rising edge trigger signal, and the trigger point to migrate until it can not move, trigger the oscilloscope, open the waveform hold, you can roughly look at the signal eye diagram, but the results will prefer, at least jitter will be small.
If you do not have a high-end oscilloscope at hand, but need to observe the eye diagram on the oscilloscope to understand the general situation of the signal and make simple measurements, then use the Tektronix DPO2000B, MSO2000B, MDO3000, DPO4000B, MSO4000B, MDO4000B series and other economic oscilloscopes on the eye diagram measurement can be achieved through simple settings. Specific settings are as follows.
1, the signal observed when triggered with the edge.
2, select the trigger mode for ascending / descending time, the slope to ascending or descending.
3, the trigger threshold high and low levels are adjusted to a suitable position, preferably with low values around 10%-20% and high values around 80%-90%, to indicate the threshold range of the rise and fall time trigger.
4, according to the measured signal (estimated out) the approximate size of the rise and fall time, select the trigger time less than the time.
5, set up after seeing the waveform as shown in the figure, there is no cumulative effect at this time.
6, open the function of afterglow, and turn up the brightness of the waveform, you can observe whether there are abnormal signals occurring.