


What are some of the ways in which a spectrum analyzer can perform some routine parameter measurements?


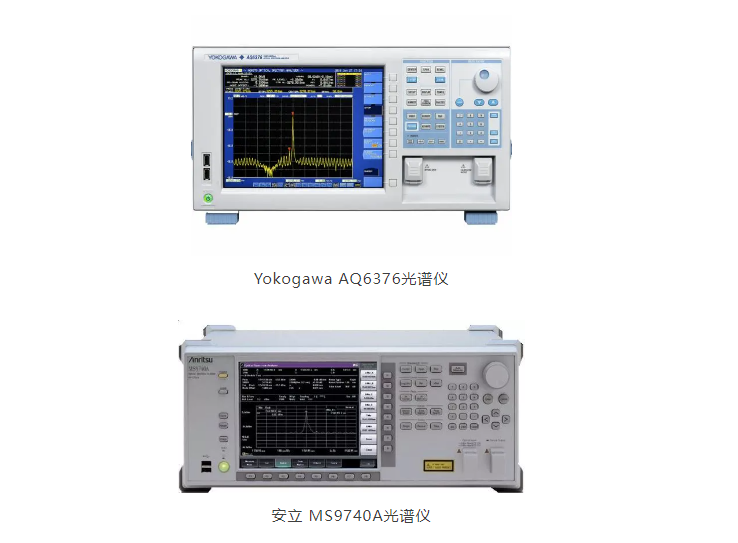
The application of spectrum analyzers in fiber optic communication products, using the AQ6370 spectrum analyzer as an example, details the use of spectrum analyzers for some routine parameter measurements. These parameters include the bandwidth of the spectrum, side-mode rejection ratio, gain, noise figure and system OSNR. The article also mentions some of the basic features of the spectrum analyzer, such as the screen display of measurement conditions, marker values and other data, and how to perform measurements of specific parameters through different menus. This article emphasizes the importance of proficiency in the use of spectrum analyzers and encourages sharing and communication to promote the development and application of the technology.
Translated with DeepL.com (free version)
Spectrum analyzers are indeed an important tool in the field of optical communications, especially in the testing and maintenance of wavelength division multiplexing (WDM) systems. Such instruments are designed to meet the need for high accuracy and resolution to be able to accurately measure and analyze the performance of each channel in a WDM network. Here are some key features about spectrum analyzers:
Dynamic Range: High dynamic range allows the spectrum analyzer to detect changes from strong to very weak signals, which is necessary to monitor the various signal strengths in a WDM system.
Sensitivity: High sensitivity means that even very low power signals can be detected, which is important for monitoring signal attenuation after long distance transmission.
Resolution bandwidth: A small resolution bandwidth helps to differentiate between neighboring wavelength channels, which is especially important for dense wavelength division multiplexing (DWDM) systems where the channel spacing can be very small.
Measurement wavelength range: A wide measurement range covering multiple wavelength bands from the visible to the near infrared allows the spectrum analyzer to be adapted to a wide range of applications.
Accuracy: While the wavelength accuracy of a spectrum analyzer is usually sufficient for most testing needs, where extreme accuracy is required, a multi-wavelength meter (e.g., a Fabry-Perot interferometer-based device) may provide more accurate results.
Integrated software: Modern spectrum analyzers are often equipped with specialized WDM analysis software that automatically identifies and analyzes the center frequency, power, and OSNR of each wavelength channel, simplifying the data analysis process.
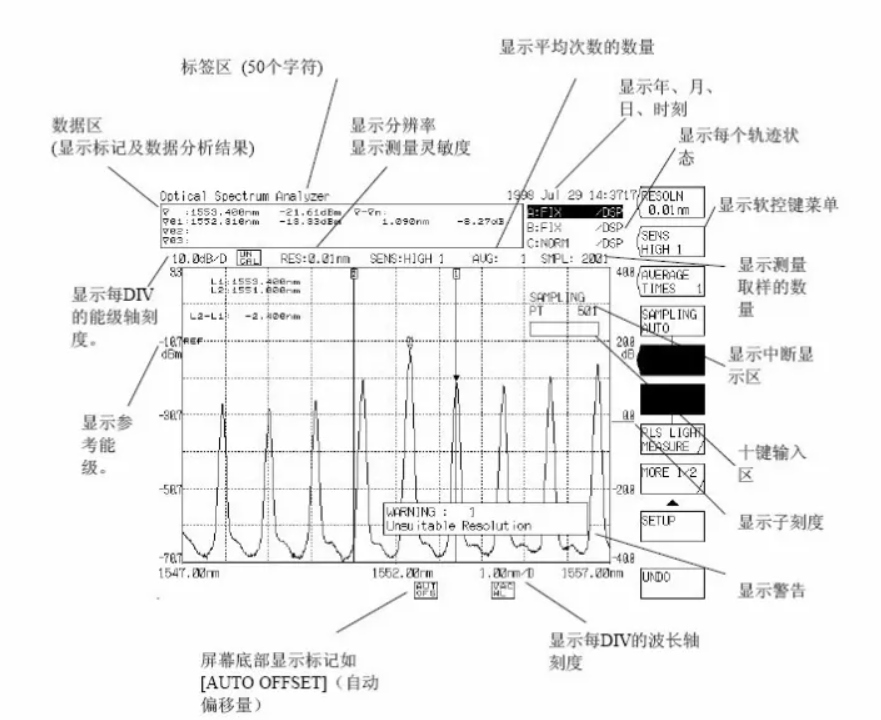
The screen of the spectrum analyzer displays measurement conditions, marker values, other data, and measurement waveforms. The names of each part of the screen are displayed as follows:
Translated with DeepL.com (free version)
Measurement of Spectral Width
Spectral width (or spectral width) is an important parameter, especially in the performance evaluation of laser light sources such as laser diodes (LDs) and light emitting diodes (LEDs). Spectral width defines the width of the spectral energy distribution and, in the case of lasers, reflects the degree of monochromaticity. The narrower the spectral width, the better the monochromaticity of the laser.
Choosing the resolution of a spectrum analyzer
When measuring spectral width, the resolution setting of the spectrum analyzer is crucial. The choice of resolution should follow the following principles:
The resolution should be less than 1/10 of the spectral width of the measured signal, which is an ideal situation to ensure the accuracy of the measurement. However, in practice, at least the resolution is required to be less than 1/5 of the spectral width of the measured signal to ensure the reliability of the measurement results.
Setting of resolution bandwidth: In practice, in order to obtain the most accurate data possible, the resolution bandwidth is usually set very small, such as below 0.1nm, which is especially important for high resolution requirements.
How to set the resolution bandwidth
The resolution bandwidth (RES) is usually the first parameter that can be set in the SETUP menu of the spectrum analyzer. The desired resolution bandwidth value can be set by directly entering it.
This is shown in the figure below (the figure only serves to distinguish the difference in spectral shapes)
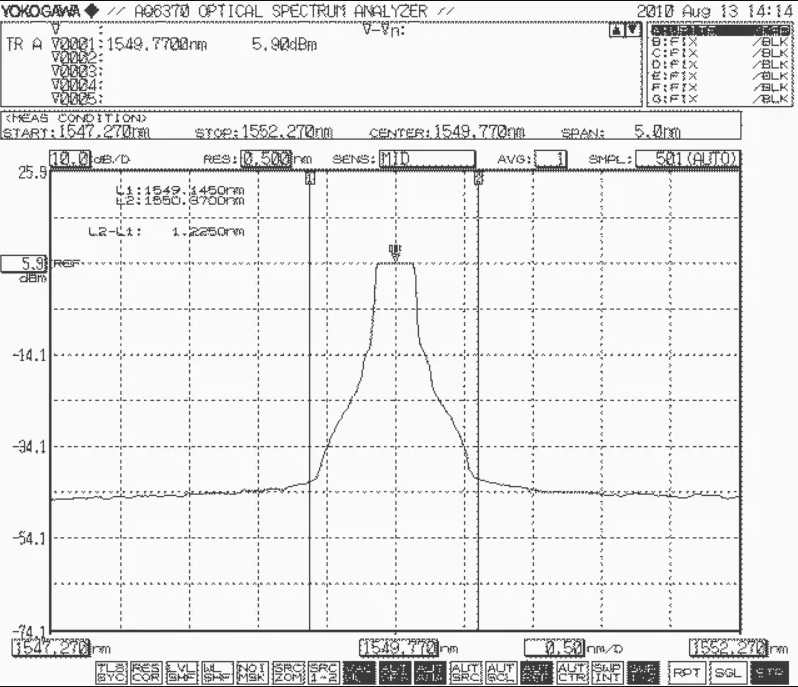
Resolution bandwidth RES=0.5nm
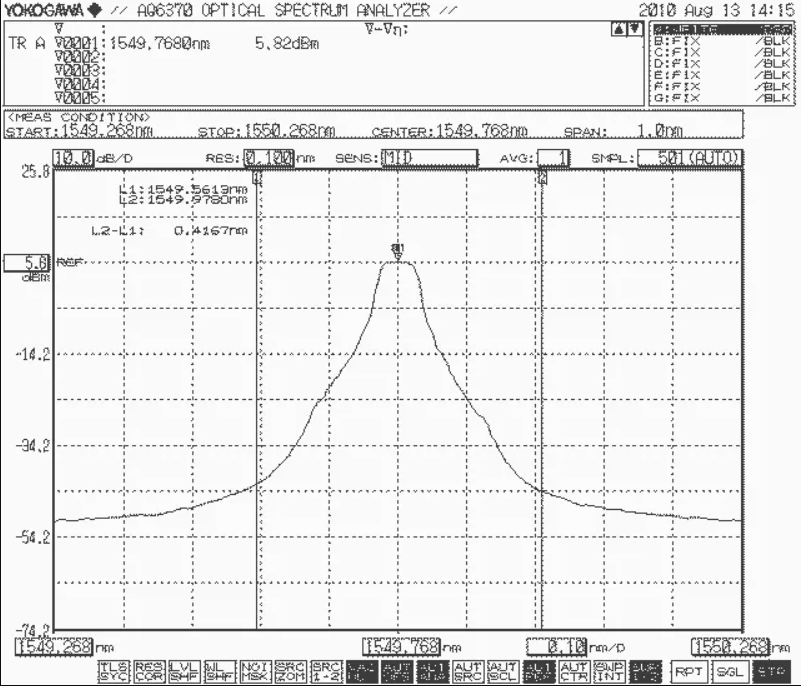
Resolution bandwidth RES=0.1nm

Resolution bandwidth RES=0.02nm
Measurement of Side-Mode Suppression Ratio
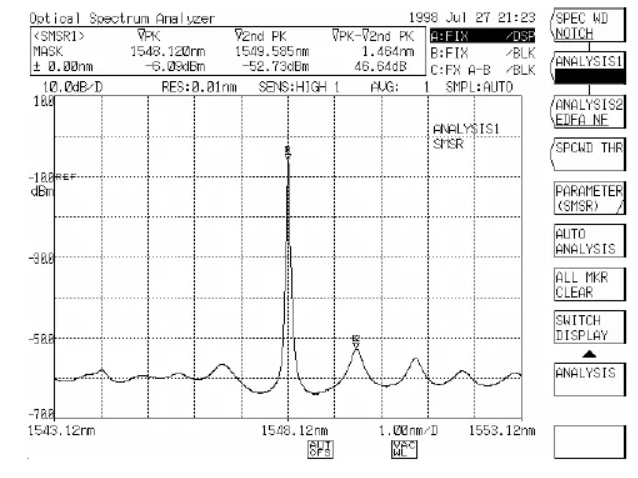
Side-Mode SuppressionRatio (abbreviated SMSR), SMSR represents the energy level difference between the peak energy level and the transverse mode energy level. It is necessary to use the corresponding keys in the MARKER menu and the ANALYSIS menu in conjunction. The main wave peak and the highest sub-wave peak are identified using the MARKER menu, and the peak power values of both are read. The Side Mode Rejection Ratio is the energy level difference between the highest peak and the next highest peak. The final value can be calculated with the corresponding sub-option in the ANALYSIS menu.
The application of spectrum analyzers in fiber optic communication products, using the AQ6370 spectrum analyzer as an example, details the use of spectrum analyzers for some routine parameter measurements. These parameters include the bandwidth of the spectrum, side-mode rejection ratio, gain, noise figure and system OSNR. The article also mentions some of the basic features of the spectrum analyzer, such as the screen display of measurement conditions, marker values and other data, and how to perform measurements of specific parameters through different menus. This article emphasizes the importance of proficiency in the use of spectrum analyzers and encourages sharing and communication to promote the development and application of the technology.
Translated with DeepL.com (free version)
Spectrum analyzers are indeed an important tool in the field of optical communications, especially in the testing and maintenance of wavelength division multiplexing (WDM) systems. Such instruments are designed to meet the need for high accuracy and resolution to be able to accurately measure and analyze the performance of each channel in a WDM network. Here are some key features about spectrum analyzers:
Dynamic Range: High dynamic range allows the spectrum analyzer to detect changes from strong to very weak signals, which is necessary to monitor the various signal strengths in a WDM system.
Sensitivity: High sensitivity means that even very low power signals can be detected, which is important for monitoring signal attenuation after long distance transmission.
Resolution bandwidth: A small resolution bandwidth helps to differentiate between neighboring wavelength channels, which is especially important for dense wavelength division multiplexing (DWDM) systems where the channel spacing can be very small.
Measurement wavelength range: A wide measurement range covering multiple wavelength bands from the visible to the near infrared allows the spectrum analyzer to be adapted to a wide range of applications.
Accuracy: While the wavelength accuracy of a spectrum analyzer is usually sufficient for most testing needs, where extreme accuracy is required, a multi-wavelength meter (e.g., a Fabry-Perot interferometer-based device) may provide more accurate results.
Integrated software: Modern spectrum analyzers are often equipped with specialized WDM analysis software that automatically identifies and analyzes the center frequency, power, and OSNR of each wavelength channel, simplifying the data analysis process.
The screen of the spectrum analyzer displays measurement conditions, marker values, other data, and measurement waveforms. The names of each part of the screen are displayed as follows:
Translated with DeepL.com (free version)
Measurement of Spectral Width
Spectral width (or spectral width) is an important parameter, especially in the performance evaluation of laser light sources such as laser diodes (LDs) and light emitting diodes (LEDs). Spectral width defines the width of the spectral energy distribution and, in the case of lasers, reflects the degree of monochromaticity. The narrower the spectral width, the better the monochromaticity of the laser.
Choosing the resolution of a spectrum analyzer
When measuring spectral width, the resolution setting of the spectrum analyzer is crucial. The choice of resolution should follow the following principles:
The resolution should be less than 1/10 of the spectral width of the measured signal, which is an ideal situation to ensure the accuracy of the measurement. However, in practice, at least the resolution is required to be less than 1/5 of the spectral width of the measured signal to ensure the reliability of the measurement results.
Setting of resolution bandwidth: In practice, in order to obtain the most accurate data possible, the resolution bandwidth is usually set very small, such as below 0.1nm, which is especially important for high resolution requirements.
How to set the resolution bandwidth
The resolution bandwidth (RES) is usually the first parameter that can be set in the SETUP menu of the spectrum analyzer. The desired resolution bandwidth value can be set by directly entering it.
This is shown in the figure below (the figure only serves to distinguish the difference in spectral shapes)
Resolution bandwidth RES=0.5nm
Resolution bandwidth RES=0.1nm
Resolution bandwidth RES=0.02nm
Measurement of Side-Mode Suppression Ratio
Side-Mode SuppressionRatio (abbreviated SMSR), SMSR represents the energy level difference between the peak energy level and the transverse mode energy level. It is necessary to use the corresponding keys in the MARKER menu and the ANALYSIS menu in conjunction. The main wave peak and the highest sub-wave peak are identified using the MARKER menu, and the peak power values of both are read. The Side Mode Rejection Ratio is the energy level difference between the highest peak and the next highest peak. The final value can be calculated with the corresponding sub-option in the ANALYSIS menu.